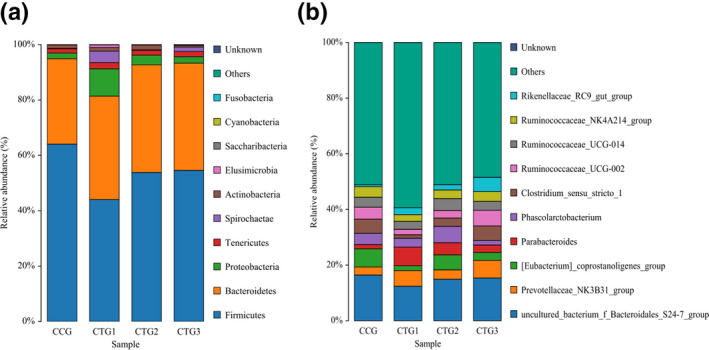
FIGURE 6.

The phylum (a) and genus (b) level. Note: a color represents a species and the color block length represents the relative abundance ratio of species. The top ten species of abundance level were selected for analysis and other species were combined with others. As shown in the figure, unclassified represents the species not annotated by taxonomy. CCG, CTG1, CTG2 and CTG represent control group, treatment group 1, treatment group 2 and treatment group 3, respectively
