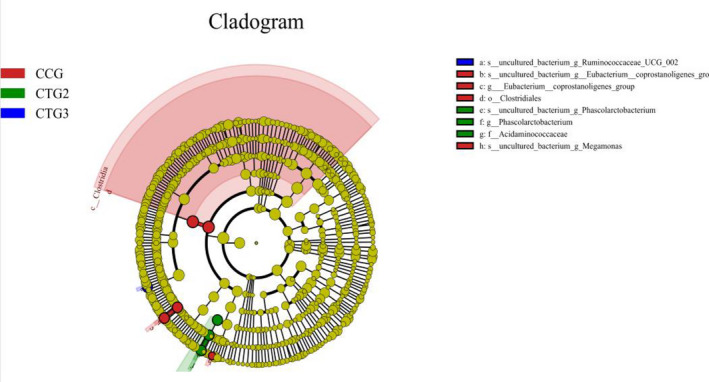
FIGURE 7.

The LefSe analysis. Note: LefSe (Line Discriminant Analysis (LDA) Effect Size) is able to find the Biomarker with statistical difference between different groups. The coloring principle is to uniformly color the species with no significant difference to yellow, while other different species are colored according to the group with the highest abundance of the species. CCG, CTG1, CTG2 and CTG represent control group, treatment group 1, treatment group 2 and treatment group 3, respectively
