
FIGURE 3.
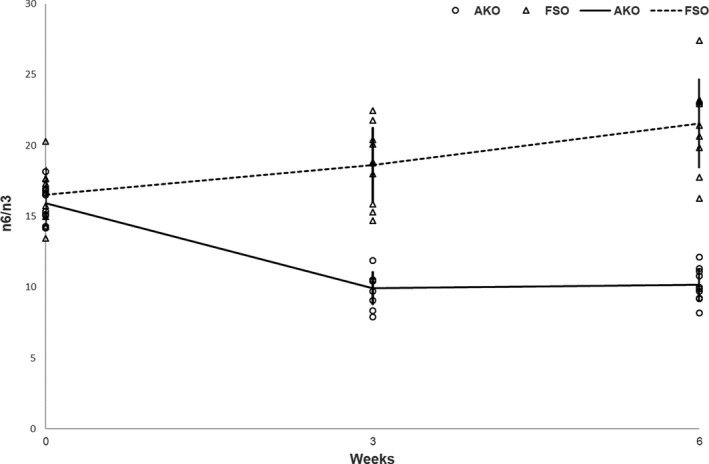
The mean n‐6/n‐3 ± SD values at the three time points, baseline (0 weeks), mid (3 weeks) and end (6 weeks) of the study period by supplement type
Official websites use .gov
A
.gov website belongs to an official
government organization in the United States.
Secure .gov websites use HTTPS
A lock (
) or https:// means you've safely
connected to the .gov website. Share sensitive
information only on official, secure websites.
The mean n‐6/n‐3 ± SD values at the three time points, baseline (0 weeks), mid (3 weeks) and end (6 weeks) of the study period by supplement type