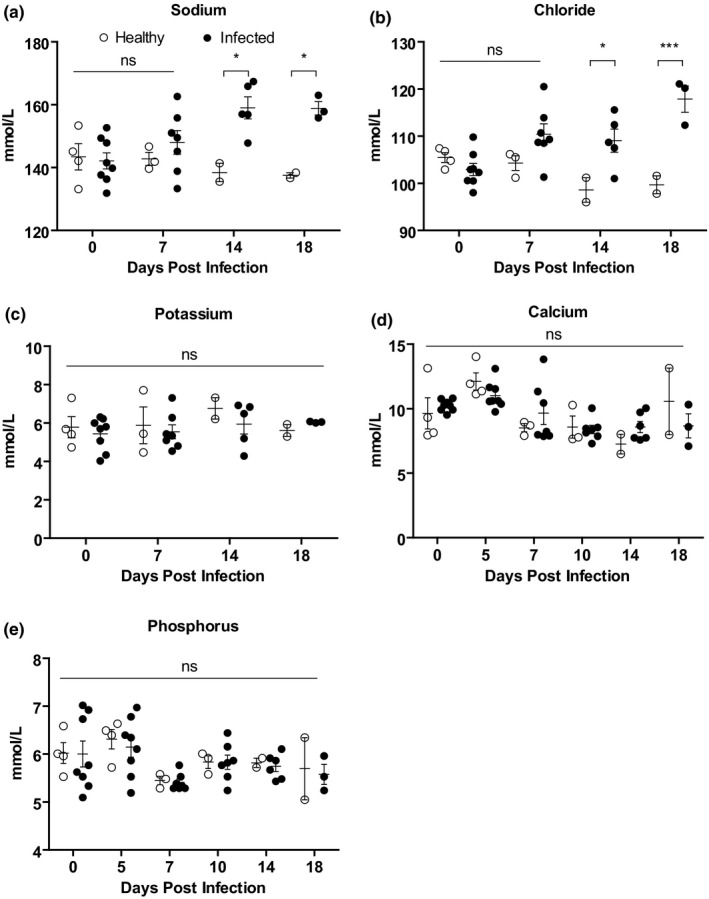
FIGURE 5.

Serum electrolyte analysis of PPRV‐infected Black Bengal goats. Blood samples were collected from healthy and infected goats and the amount of (a) sodium, (b) chloride, (c) potassium, (d) calcium and (e) phosphorus are shown. Data indicate mean ± SEM of 2–8 animals. One‐tailed Mann–Whitney test. p ≤ 0.05 indicates statistical significance
