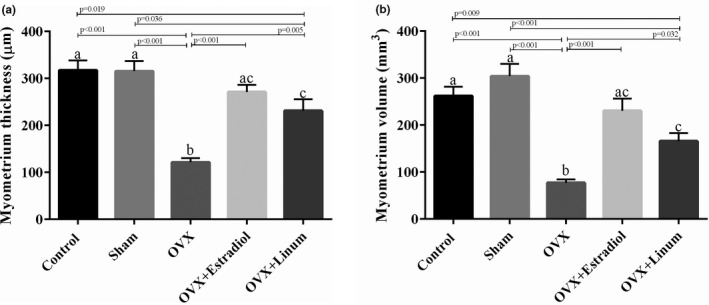
FIGURE 7.

Effect of treatment on myometer ovarian thickness (a) and volume (b). According to the posthoc Tukey test which used for intergroup comparisons, groups with same superscripted letters were not significantly different at α = 0.05(p ≥ .05). However, dissimilar letters indicate a significant difference (p < .05). ac letters above the error bars of the histogram show no significant difference among mentioned group and a and c groups
