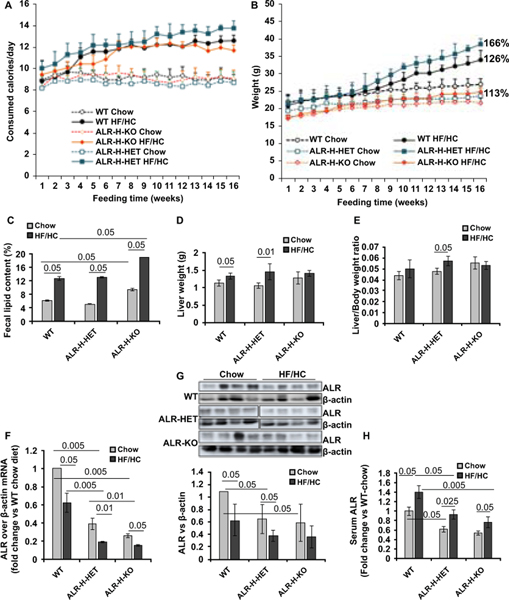
Figure 1: Caloric consumption, weight gain and ALR levels in HF/HC-fed WT, ALR-H-HET and ALR-H-KO mice.
(A, B) Weekly caloric consumption and body weight gain of mice fed chow or HF/HC diet for 16 weeks. Numbers against the filled symbols indicate total % weight gain at the end of HF/HC vs chow feeding in mice of respective ALR-genotype. (C) Fecal lipid, (D) liver weight and (E) liver/body weight ratio at the end of HF/HC feeding. (F) Hepatic ALR mRNA (qRT-PCR) and (G) protein (Upper panel shows Western blot); bar graph in lower panel shows ALR protein expression relative to β-actin. (H) Serum ALR in chow- or HF/HC-fed mice; values are expressed as fold-change vs serum ALR in chow-fed WT mice, the concentration being 1523 ± 136 pg/ml.

