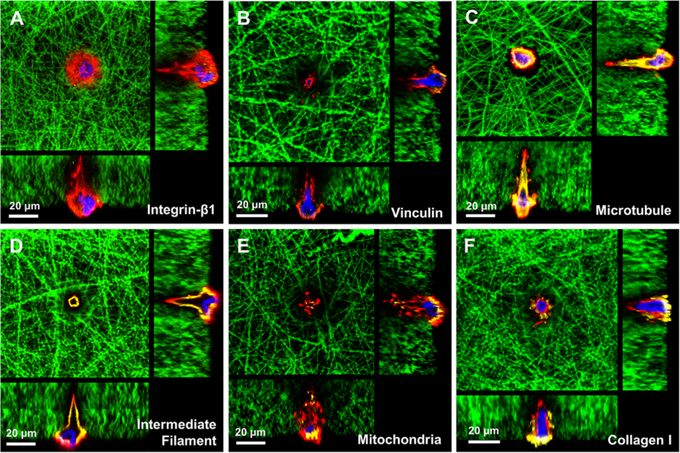
Figure 3.
Confocal cross-sectional images showing the cellular components of a single DPSC on a tubular microisland. Cell adhesion markers integrin β1 (A) and vinculin (B). Cytoskeletal components, microtubule (C) and intermediate filament vimentin (D). Mitochondria distribution (E) and collagen expression (F) within a DPSC. Red represents phalloidin-633-conjugated actin filaments, green represents FITC-conjugated nanofibers, blue represents nuclei, and yellow indicates integrin β1 (A), vinculin (B), β-tubulin (C), vimentin (D), mitochondria (E), and collagen I (F).

