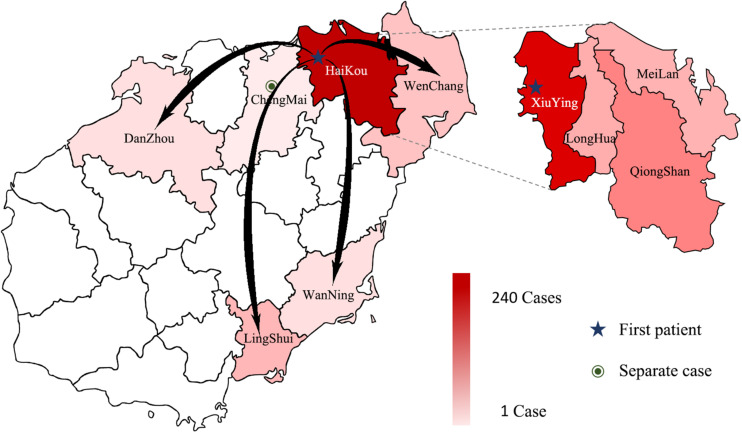
FIGURE 2.
The distribution of DENV in Hainan in 2019. The intensity of the colors in the figure indicates the number of dengue cases; the darker the color is, the more dengue cases there were in the area, arrows indicate the possible direction of propagation, dotted lines show the four Districts of Haikou city.

