
Figure 3:
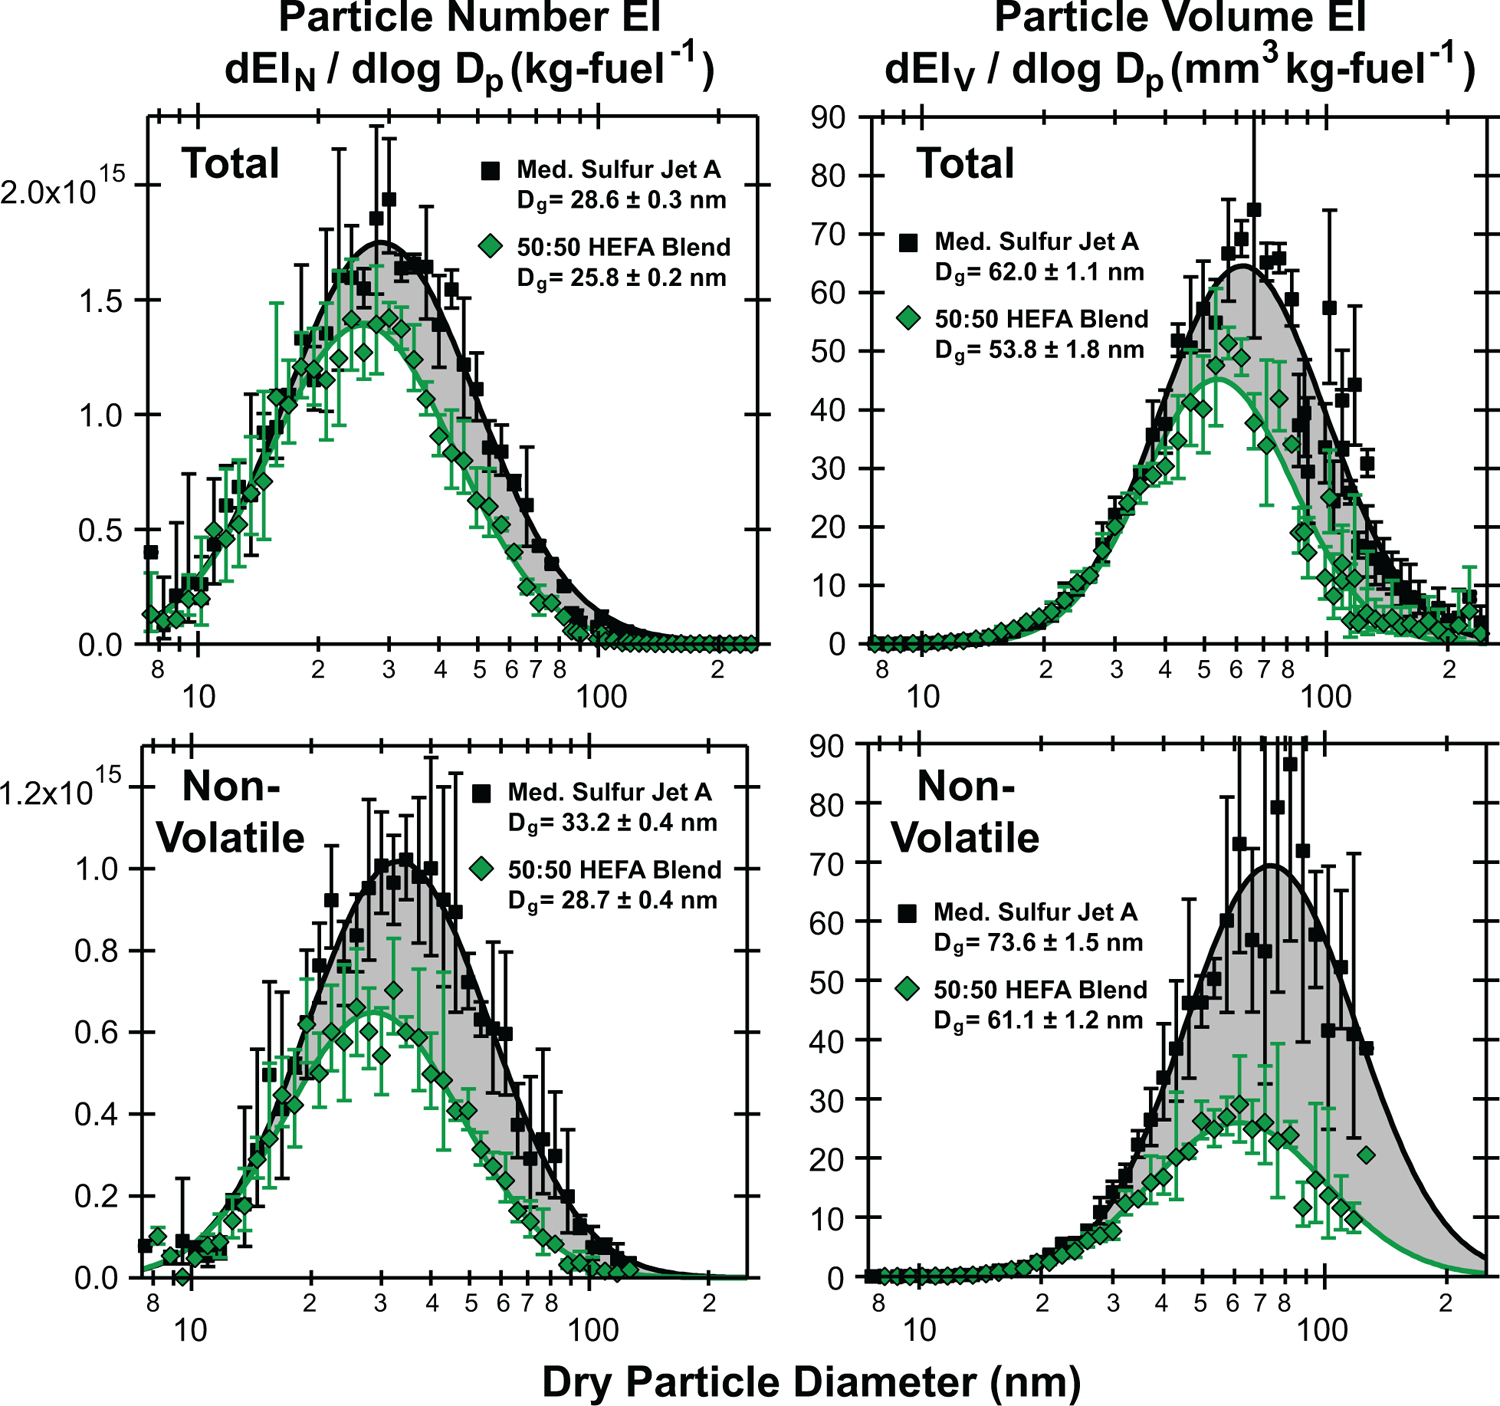
Particle number (left) and volume (right) EI size distributions for the total (top) and non-volatile fraction (bottom) measured at the high thrust condition behind the #3 engine. Points are geometric means and error bars are the geometric standard deviation (N = 4 and 6 for the High Sulfur Jet A and 50:50 Low Sulfur Jet A – HEFA blend, respectively). Solid lines are lognormal fits and the shaded area represents the difference between the two curves. The geometric mean diameter for each fit are denoted in the legend, while all fit parameters are given in the SOM.