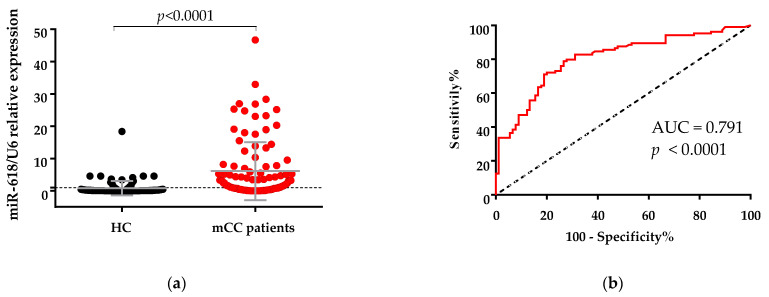
Figure 1.
(a) Comparison between levels of miR-618 in serum samples from healthy controls (HC) and patients with metastatic colon cancer (mCC) (Mann-Whitney U test, data are presented as mean ± SD). The expression levels were measured using qPCR. U6 RNA was used as an internal control. Relative gene expression was calculated using 2−∆∆Ct method. (b) Receiver operation characteristics (ROC) curve of using miR-618 to differentiate patients with mCC from healthy controls. Area under the ROC curve (AUC) is 0.791, p < 0.0001.

