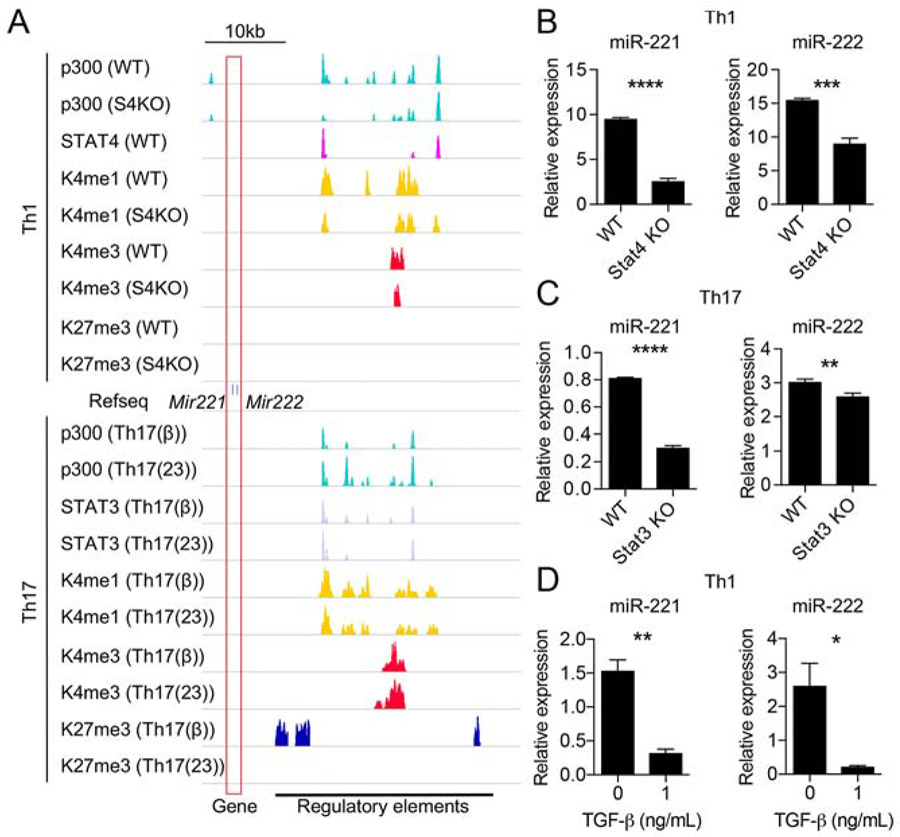
Figure 1. Regulation of miR-221 and miR-222 expression in Th1 and Th17 cells.
(A) Chromatin landscape of the extended Mir221 and Mir222 locus (boxed in red) in Th1 cells (above Mir221 and Mir222 gene track) and Th17 cells (below Mir221 and Mir222 track). For Th1 condition, wild type (WT) and STAT4 deficient (S4KO) cells were evaluated. For Th17 condition, TGF-β (TGF-β+IL-6) and IL-23 (IL-6+IL-23) conditions were used with WT cells. ChIP-seq for binding of p300, STAT4, STAT3, H3K4me1,H3 K4me3, H3K27me3 are shown (Table S1; data are derived from GSE40463 (Vahedi et al., 2012), GSE22104 (Wei et al., 2010), GSE23681 (Ghoreschi et al., 2010), and GSE65621 (Hirahara et al., 2015). Putative regulatory regions with enhancer activity are marked at the bottom.
(B-D) RT-qPCR analysis of miR-221- and miR-222-3p expression in Th1 conditions comparing WT and S4KO (B), Th17-full conditions (TGF-β, IL-23 and others; see Materials and Methods) comparing WT and S3KO (C), and Th1 conditions +/− TGF-β (D). (*p<0.05, **p<0.01, ***p<0.005, ****p<0.001; Student’s t-test) Data are representative of at least 2 independent experiments. Data are shown as means with SD. See also Figure S1.

