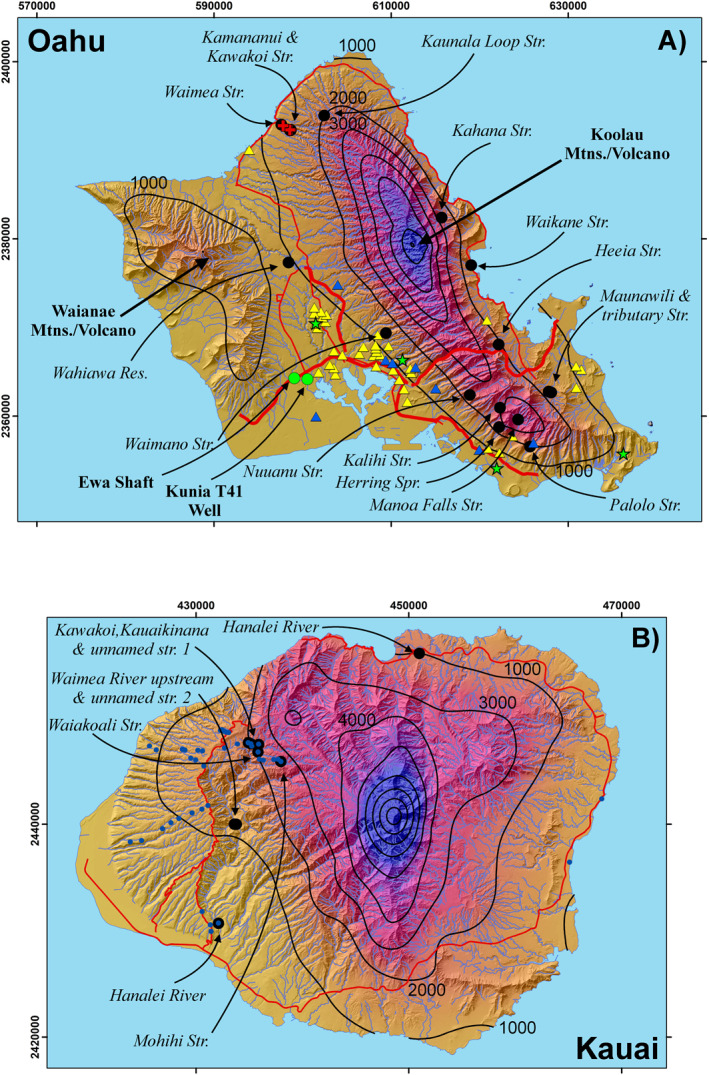
Figure 2.

(a) Index map for Oahu indicating stream, spring, and reservoir sampling sites (black circles, labeled). Black circles also indicate the location of streamside soil samples. Also shown are the locations of homes testing positive for nontuberculous mycobacterial (NTM) in DNA swabs (yellow triangles) as well as those testing negative (blue triangles). Locations are approximate to maintain homeowner privacy. Locations for the Ewa Shaft and Kunia T41 Deep Monitoring Well are indicated by green circles. Red crosses indicate the location of gain/loss measurements conducted along a small stretch of the Waimea Stream on August 4, 2018. Green stars indicate the location of dust traps (not discussed here). (b) Index map for Kauai indicating the location of stream samples and soils (blue dots). Red lines are selected major roads. Precipitation contours (1,000 mm annual rainfall interval; Frazier et al., 2016) and draped over a hillshade base map. Coordinates are UTM, NAD83, Zone 4N.
