Figure 1.
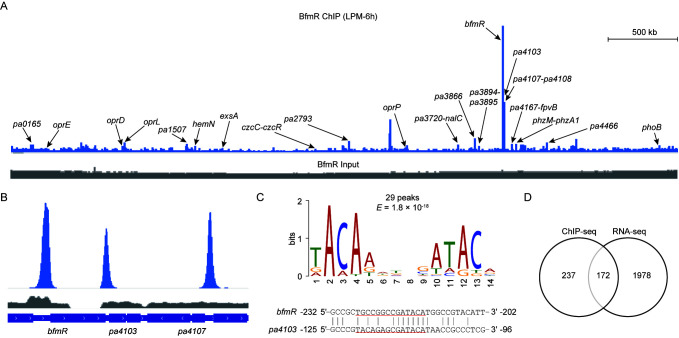
Analysis of BfmR ChIP-seq. (A) A representative image of BfmR ChIP-seq result using Integrated Genome Viewer. Bacteria were cultured in low-phosphate minimal (LPM) for 6 h (LPM-6h). ChIP sample (blue) and input control sample (grey) were shown as indicated. Arrows indicate the gene promoters associated with the ChIP-seq peaks. (B) Pattern of BfmR ChIP-seq peaks for the promoter regions of bfmR, pa4103, and pa4107. (C) The most significant motif generated by the MEME tool [34] using 101 bp centered on the peak summit of the top 30 peak sequences (Data set 1, sheet 1) with default parameter values. The height of each letter represents the frequency of each base in different locations in the consensus sequence. The 14 nt motif was present in 29 BfmR binding sites with an E-value of 1.8 × 10⁻¹⁸ (upper panel). The location of the conserved promoter element generated by MEME (upper panel) on the BfmR-protected region of either bfmR or pa4103 promoter [11] was underlined (lower panel). (D) Venn diagram of integrated ChIP-seq and RNA-seq results showing the direct and indirect targets of BfmR (Data set 2).

