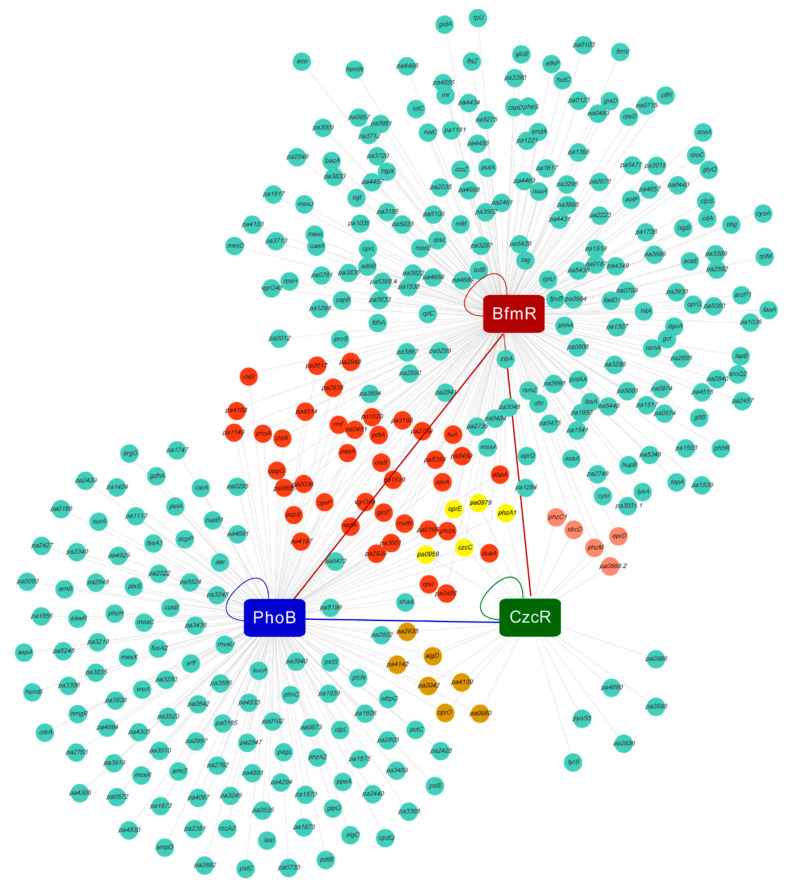
Figure 4.
Visualization of promoters bound by BfmR, PhoB, and CzcR. Red circle denotes gene (or the first gene in an operon) whose promoter is co-regulated by BfmR and PhoB; yellow circle, gene co-regulated by BfmR, PhoB, and CzcR; pink circle, co-targeted by BfmR and CzcR; brown circle, co-targeted by PhoB and CzcR. The lines show the connection between the transcription factors and promoters. The curved line represents the binding of the transcription factor to its own promoter [11,53,58,64]. Red lines show the binding of BfmR to the promoters phoB and czcR (Figure 1B, Figure 3A and Figure 5A); Blue line show the binding of PhoB to czcR promoter (Figure 3A and Figure 5A). See Data set 4, Sheet 1 for details.

