Figure 5.
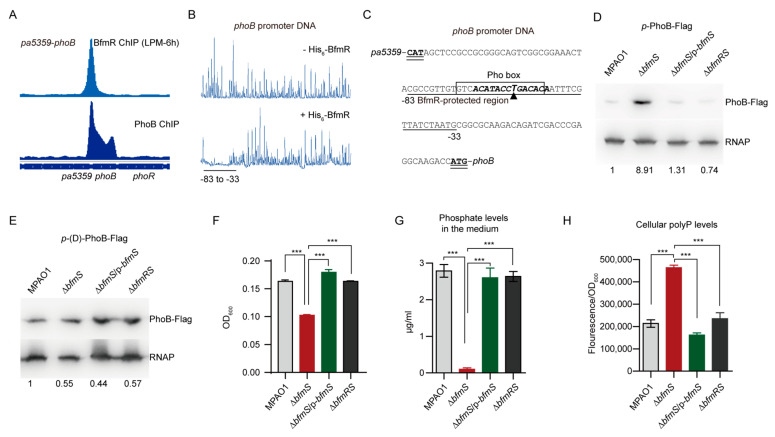
BfmR binds to and activates phoB promoter. (A) BfmR and PhoB ChIP-seq signals in phoB promoter. The PhoB ChIP data were obtained from GEO (accession number GSE128430) [58]. (B) Electropherogram shows the protection pattern of the phoB promoter DNA after digestion with DNase I following incubation without or with His6-BfmR (6 μM). The protected regions (relative to the start codon of phoB) are underlined. (C) Intergenic sequence of pa5358 and phoB with a summary of the results of DNase I footprint assays and ChIP-seq experiments. The BfmR-protected region (relative to the start codon of phoB) is underlined; triangle showing the location of the peak summit for BfmR ChIP-seq; sequences that match the MEME motifs of BfmR (see in Figure 1C) are in bold and italic. The potential Pho box [59] is highlighted by square frame, and the starting codons of pa5359 and phoB are in bold and double underlined. (D,E) Western blot assays showing the production of PhoB-Flag in P. aeruginosa MPAO1 and its derivatives grown in tubes containing LPM at 37 °C with shaking for 6 h. The FLAG-tagged PhoB fusion gene is under the control of a native (in D) or a mutant phoB promoter (in E, lack of GACACA in the BfmR-protected region). The Western blot band intensity of PhoB-Flag was normalized to the intensities obtained with RNA polymerase (RNAP) (used as a loading control) and the results are reported as fold changes with the WT MPAO1 set to 1. MPAO1, ΔbfmS, and ΔbfmRS harbor an empty pAK1900 vector as a control; p-bfmS denotes pAK1900-bfmS (Table S1). Data are representative of three biological replicates. (F) The growth of P. aeruginosa MPAO1 and its derivatives. Bacteria were grown for 24 h in LPM medium. Results represent means ± SD (n = 3 biological replicates; *** p < 0.001, Student’s two-tailed t-test); OD600, an optical density at 600 nm. (G) Phosphate removal from the medium. Bacteria were grown for 24 h in LPM medium, and the phosphate level in the spent medium was measured. The initial level of phosphate in the LPM medium is 28 µg/mL (0.3 mM). (H) Measurements of the polyphosphate (polyP) level in WT MPAO1 and its derivatives grown in LPM medium at 37 °C for 24 h. The polyP was quantified using 4’,6’-diamidino-2-phenylindole (DAPI) fluorescence as described in Methods. In (F and G), MPAO1, ΔbfmS, and ΔbfmRS harbor an empty pAK1900 vector as a control; p-bfmS denotes pAK1900-bfmS (Table S1); results represent means ± SD (n = 3 biological replicates; *** p < 0.001, Student’s two-tailed t-test).

