Figure 6.
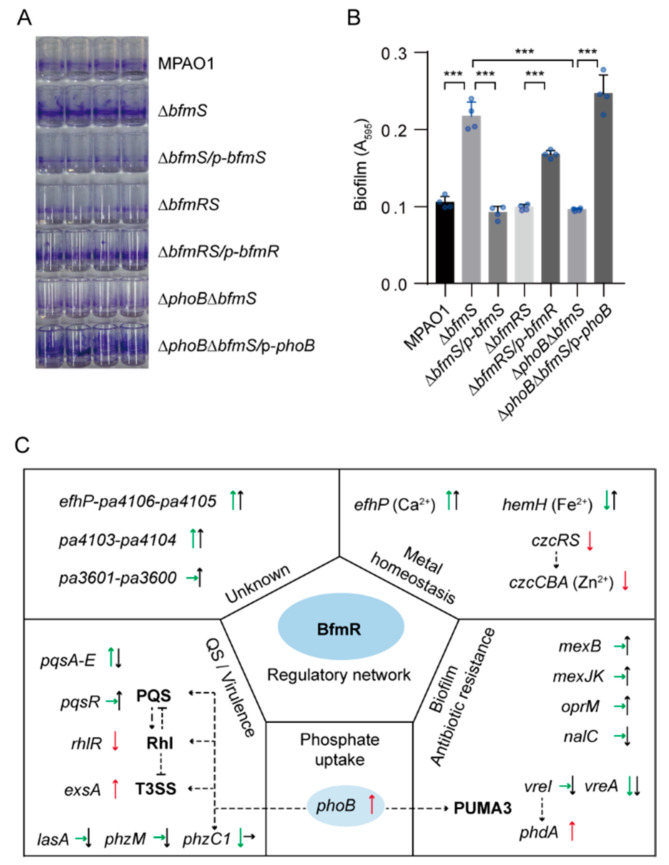
Biofilm formation assays and a proposed model of BfmR regulatory network. (A) Photograph showing ring-shape biofilms (stained by 1% crystal violet) near the air–liquid interface on the inner surface of polystyrene StripwellTM Microplate. (B) Quantification of biofilm formation in (A) by measuring the OD595 of the dye solubilized from stained biofilm. A595, absorbance at 595 nm as an indirect measure of biofilm biomass. MPAO1, ΔbfmS, ΔbfmRS, and ΔphoBΔbfmS harbor an empty pAK1900 vector as a control; p-bfmS, p-bfmR, and p-phoB respectively denote pAK1900-bfmS, pAK1900-bfmR, and pAK1900-phoB plasmids (Table S1). Data points are shown in blue dots, and results represent means ± SD (n = 4 biological replicates; *** p < 0.001, Student’s two-tailed t-test). (C) Proposal model of BfmR regulatory network. Some selected BfmR-targeted genes (operon) are shown. ChIP-seq signal was also observed for the promoters of rhlR, phdA, and vreAIR operon while it does not meet the threshold for defining BfmR targets (see detail in Figures S6A and S7A). The arrow indicates the effect of BfmR on gene expression (up arrow indicates up-regulation, down arrow indicates down-regulation, and the right arrow indicates no observed effect). Green and black arrows indicate differential gene expression according to RNA-seq experiments at 6 h and 24 h, respectively; red arrow indicates differential gene expression according to either the promoter assays in this study (Figure 3E,F, Figure 5D and Figure S4C) or the results of published data [11,18]. The dotted line shows the interaction between the players: arrow, activation; hammerheads, repression.

