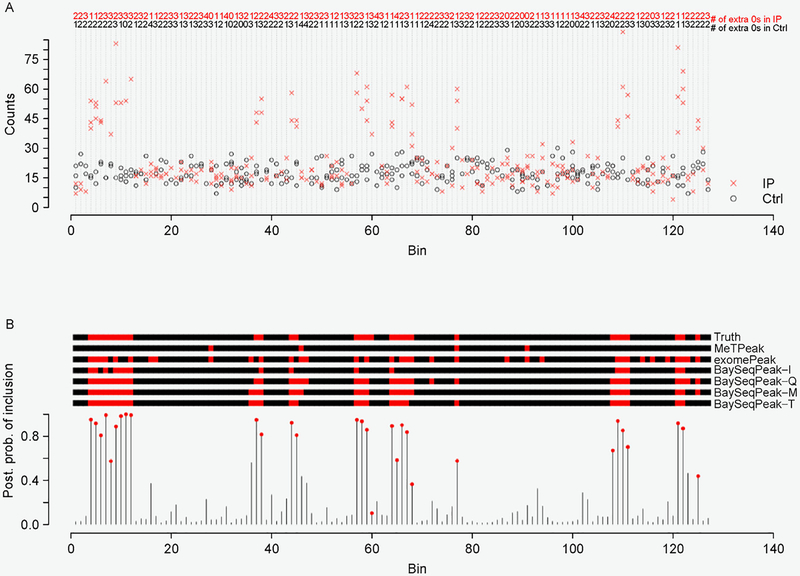
Figure 1. Examples of the model input and output.
(A) One simulated data generated from the ZINB kernel and with the fold change k = 3. Non-zero counts in the control samples are marked in black circle (o), while non-zero counts in the IP samples are marked in red cross (x). The number of extra zeros for each bin and each sample group is given at the top. (B) The marginal posterior probabilities of inclusion p(zw = 2|·) inferred by BaySeqPeak-T with the plug-in size factors . The red dots indicate the true methylated bins. The true and estimated z by MeTPeak, exomePeak (at a 5% significance level cutoff), and BaySeqPeak (with c = 0.5 cutoff) are shown in the top, where the red regions indicate methylated bins.

