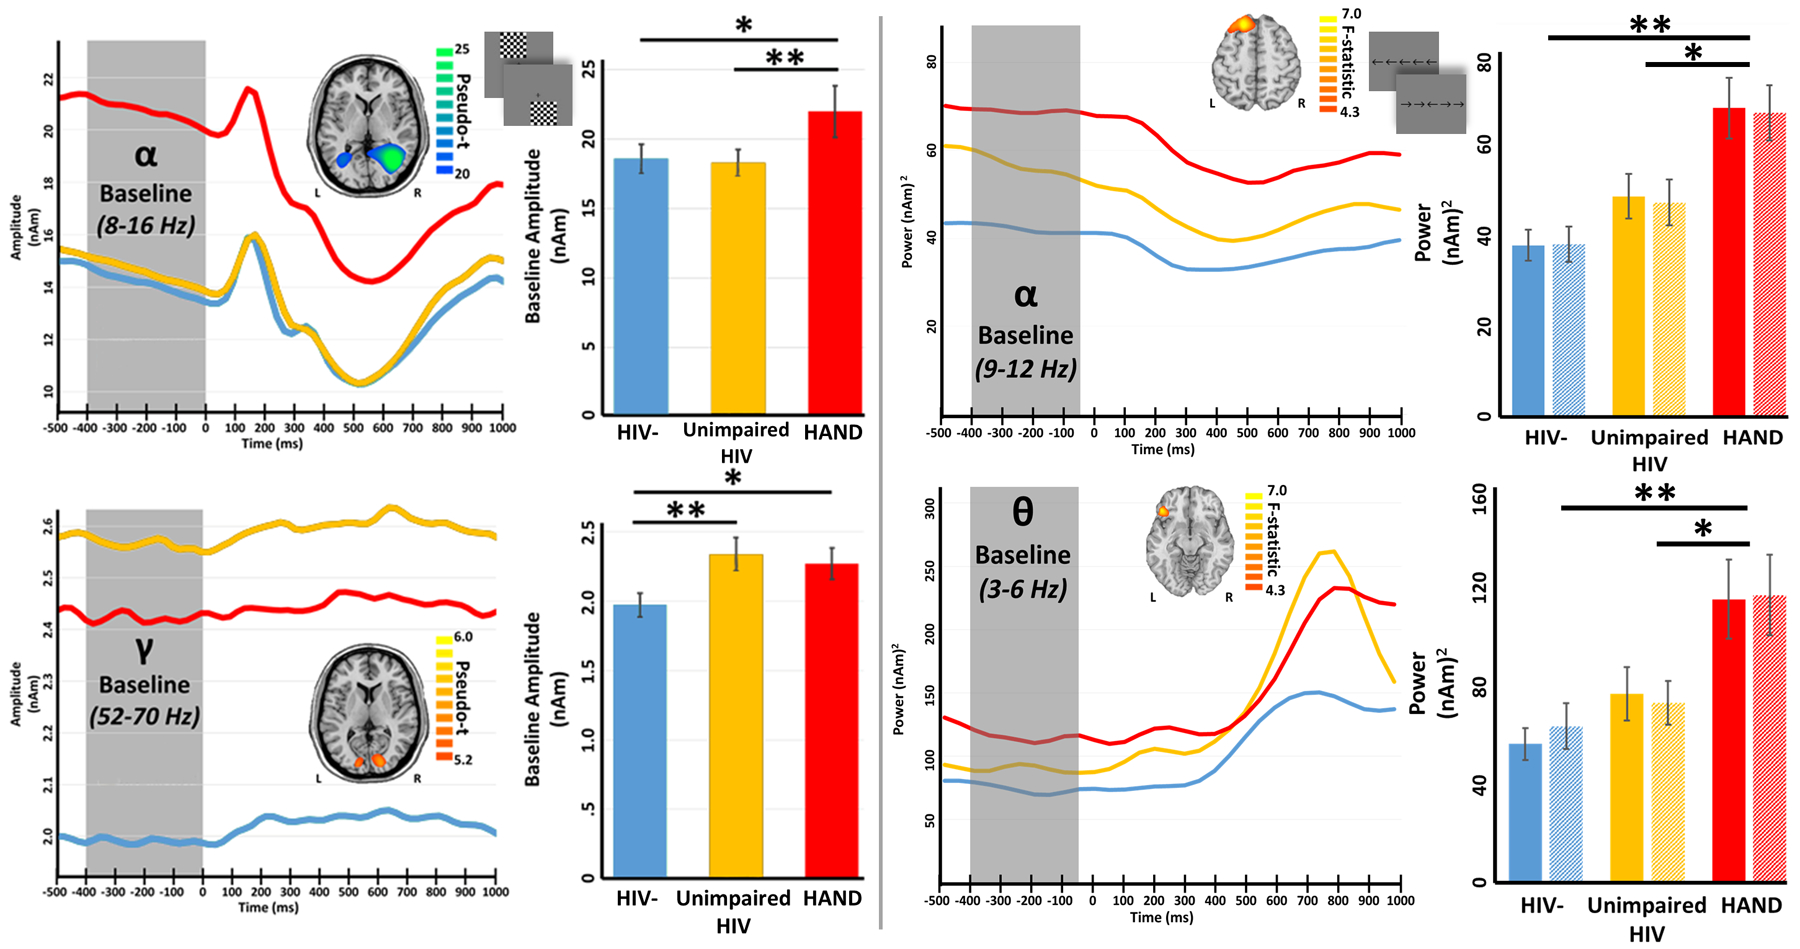
Figure 10. Spontaneous Neural Activity is Increased in HIV-infection and HAND.

(Left): Peak voxel time series during a visuo-spatial processing task is separated by group for alpha (top) and gamma (bottom) on the far left. Time (in milliseconds) is denoted on the x-axes, with 0 ms defined as the onset of the visual stimulus, and absolute amplitude (in nAm) denoted on the y-axes. The inlaid maps show the peak-voxel location where data were extracted, along with its respective color scale legend. The bar graphs to the right represent pre-stimulus amplitude values averaged across participants per group, with significance levels of post-hoc statistical analyses indicated by asterisks above the bars (*p < .05, **p < .01). Spontaneous alpha distinguished the HAND group from the other two groups, while spontaneous gamma during the baseline distinguished controls from the other two groups. (Right): Peak voxel time series during a visual selective attention task is separated by group for alpha (top) and theta (bottom) activity. All axes are the same as above, except that the y-axes show power (nAm2) instead of amplitude (nAm). As shown, alpha activity in the left superior frontal region differed between the HAND group and the other two groups, and the same was observed for theta activity in the left inferior frontal. Of note, spontaneous alpha in multiple regions distinguished all three groups (not shown).
