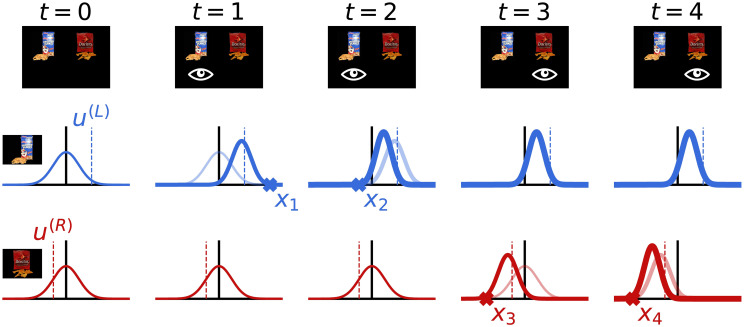
Fig 1. Sampling and belief updating in the binary choice task.
The top row shows the experimental display, with the fixated item denoted by the eye symbol. The bottom two rows depict the first few steps of the sampling and belief updating process. The decision maker’s beliefs about the value of each item are denoted by the Gaussian probability density curves. The true values of each item (dashed lines) are sampled from standard normal distributions; this is captured in the decision maker’s initial belief state (first column). Every time step, t, the decision maker fixates one of the items and receives a noisy sample about the true value of that item (xt marks). She then updates her belief about the value of the fixated item using Bayesian updating (shift from light to dark curve). The beliefs for the unfixated item are not updated. The process repeats each time step until the decision maker terminates sampling, at which point she chooses the item with maximal posterior mean.

