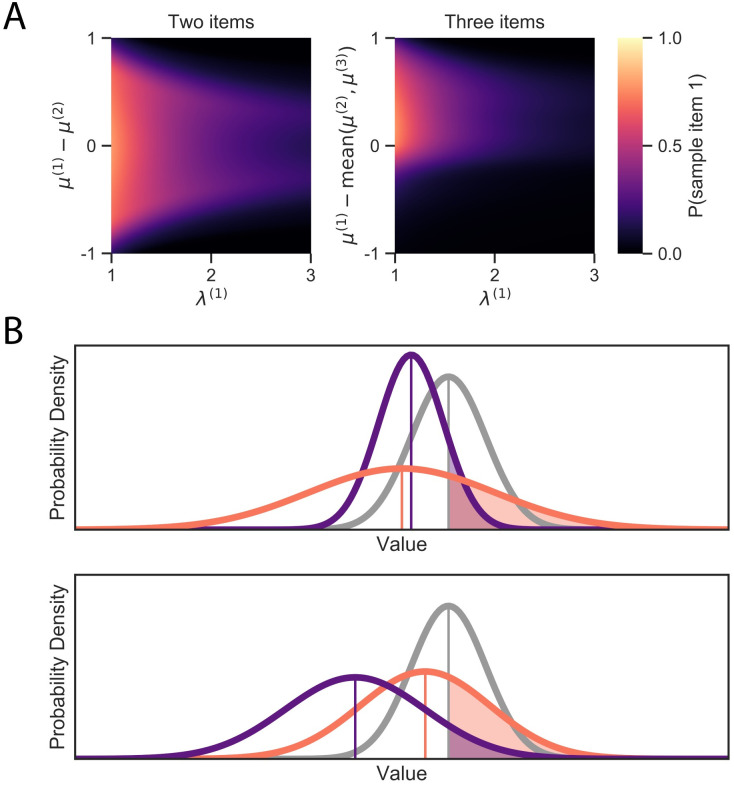
Fig 2. Optimal fixation policy.
(A) Probability of fixating on item 1 as a function of the precision of its value estimate, λ(1), and the mean of its relative value estimate, μ(1) − mean(μ(2), μ(3)). The heat map denotes the probability of fixating item 1 as opposed to fixating one of the other items or terminating the sampling process. (B) Illustration of the value of sampling. Each panel shows a belief state for trinary choice. The curves depict the estimated beliefs for each item’s value, and the shaded regions show the probability that the item’s true value is higher than the current best value estimate. This probability correlates strongly with the value of sampling the item because sampling is only valuable if it changes the choice (the full value of sampling additionally depends on the size of the potential gain in value, as well as the cost of future samples and the possibility of sampling other items). In each case, it is more valuable to sample the orange item than the purple item because either (top) its value is more uncertain, or (bottom) its value is closer to the leading value.

