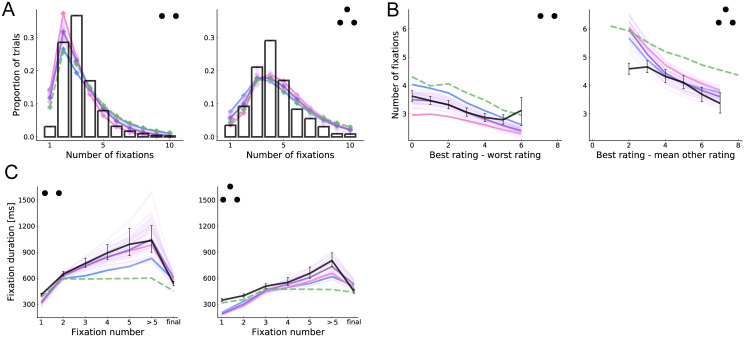
Fig 4. Basic fixation patterns.
(A) Histogram of number of fixations in a trial. (B) Number of fixations as a function of decision difficulty, as measured by the relative rating of the best item. (C) Duration of fixation by fixation number. Final fixations are excluded from all but the last bin. See Fig 3 for more details.

