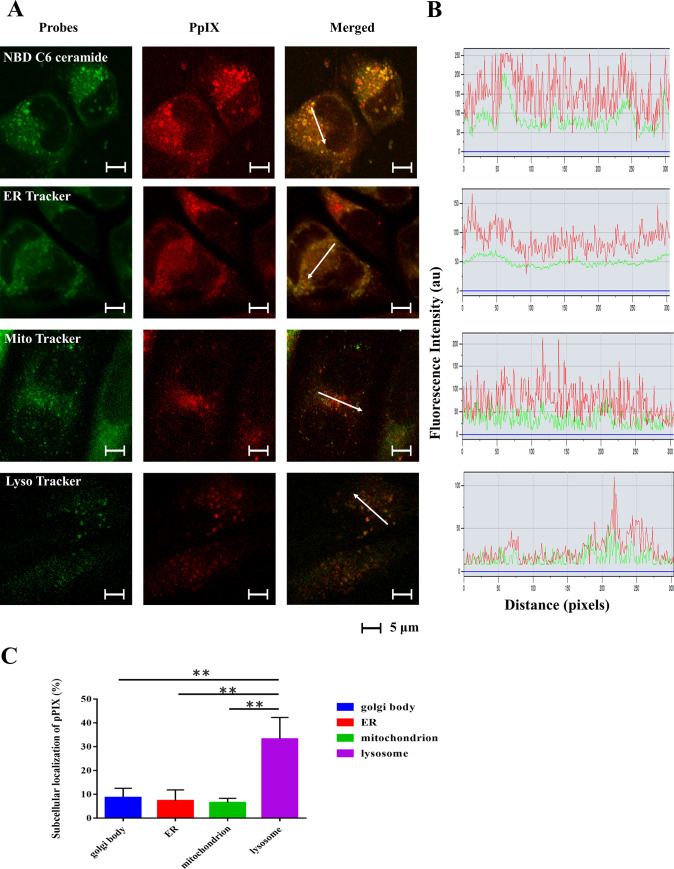
Fig 3. Subcellular localization of PpIX.
GIST-T1 cells were loaded with 5-ALA (8 mmol/L) for 2 h and stained with MitoTracker Green, LysoTracker Green, NBD-C6 ceramide Green, or ER-Tracker Green. Intracellular localization was visualized by confocal microscopy (original magnification, × 350; scale bar, 5 μm). (A) Each row represents the fluorescence of the organelle-specific probes and PpIX, respectively. (B) The fluorescence intensity profiles of PpIX (red lines) and the organelle probes (green lines) were examined along the arrows in the confocal images. (C) Quantitative analysis of subcellular localization of PpIX. Statistical significance was determined using Tukey’s multiple comparison test and was set at **P < 0.01. The rate of concordance of PpIX levels to each organelle probe was significantly higher in lysosomes (P < 0.01).

