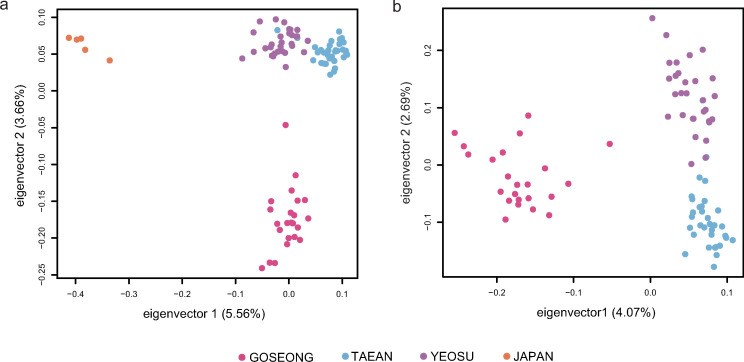
Fig 2. Relationships among Korean H. discus hannai populations determined by Principal Component Analysis (PCA).
PCA of SNV data for 91 abalone samples. 16,603 SNVs with genotypes were used in this analysis. Each dot represents an individual, and each geographic population is represented by different colors. (A) All 91 individuals (Korea and Japan), and (B) 86 individuals (Korea). Korean populations were clustered separately from Japan samples, and among Korean populations, individuals from the Goseong population were clearly separated from the Taean and Yeosu abalones which were clustered close to each other.

