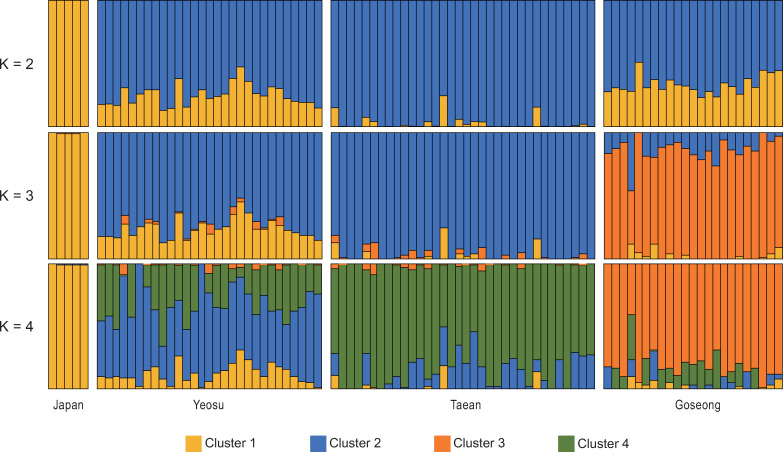
Fig 3. Genetic structures of Korean H. discus hannai populations.
Population structure using the STRUCTURE analysis. Results for K = 2 to 4 are shown. Each vertical line represents an individual, and individuals were grouped by 4 geographic populations. Colors represent the inferred ancestry from K ancestral populations. Populations are labeled below the figure. With a most likely number of K = 3, the Taean population exhibited relatively high population homogeneity, and the Yeosu population showed an admixture of cluster 1 and 2. The Goseong population was the most genetically distinct, with a high proportion of cluster 3.

