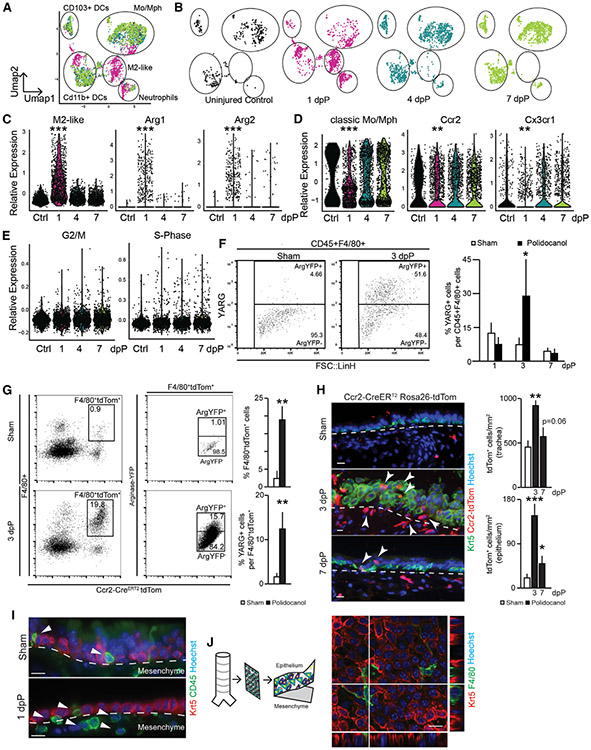
Figure 2. Dynamic Features of Tracheal Myeloid Populations after Injury.
(A) UMAP visualization of all SCRNA-seq data across airway injury and repair overlaid (3 animals pooled into 1 sample for each); captured cells: ctrl = 458, 1 dpP = 1,625, 4 dpP = 1,507, 7 dpP = 1,717.
(B) UMAP visualization of SCRNA-seq data on indicated days post-injury.
(C) Violin plots of M2-like macrophage gene signature, Arg1 and Arg2.
(D) Violin plots of classic monocyte/macrophage gene signature, Ccr2 and Cx3cr1.
(E) Violin plots of cell cycle genes associated with G2/M and S phase.
(F) Representative FACS plot and quantification of YARG expression gated on CD45+;F4/80+ (n = 3 mice per time point).
(G) FACS analysis and quantification of Ccr2-CreERT2;ROSA-tdTom+ cells from YARG animals after tamoxifen administration and sham or polidocanol treatment (n = 3, mice per time point).
(H) Immunofluorescence analysis of Ccr2-CreERT2;ROSA-tdTom animals; Krt5 (basal cells, green), Ccr2-CreERT2;ROSA-tdTom lineage trace (red), and Höechst nuclear stain (blue); scale bar, 15 μm.
(I) Histology of wild-type animals; Krt5 (red), CD45 (green), nuclear stain Höechst, scale bar, 15 μm.
(J) Confocal image of peeled epithelial sheet showing F4/80+ myeloid cells (green) and Krt5+ epithelial basal cells (red), Höechst nuclear stain. See also Figure S2 and Tables S2 and S4.

