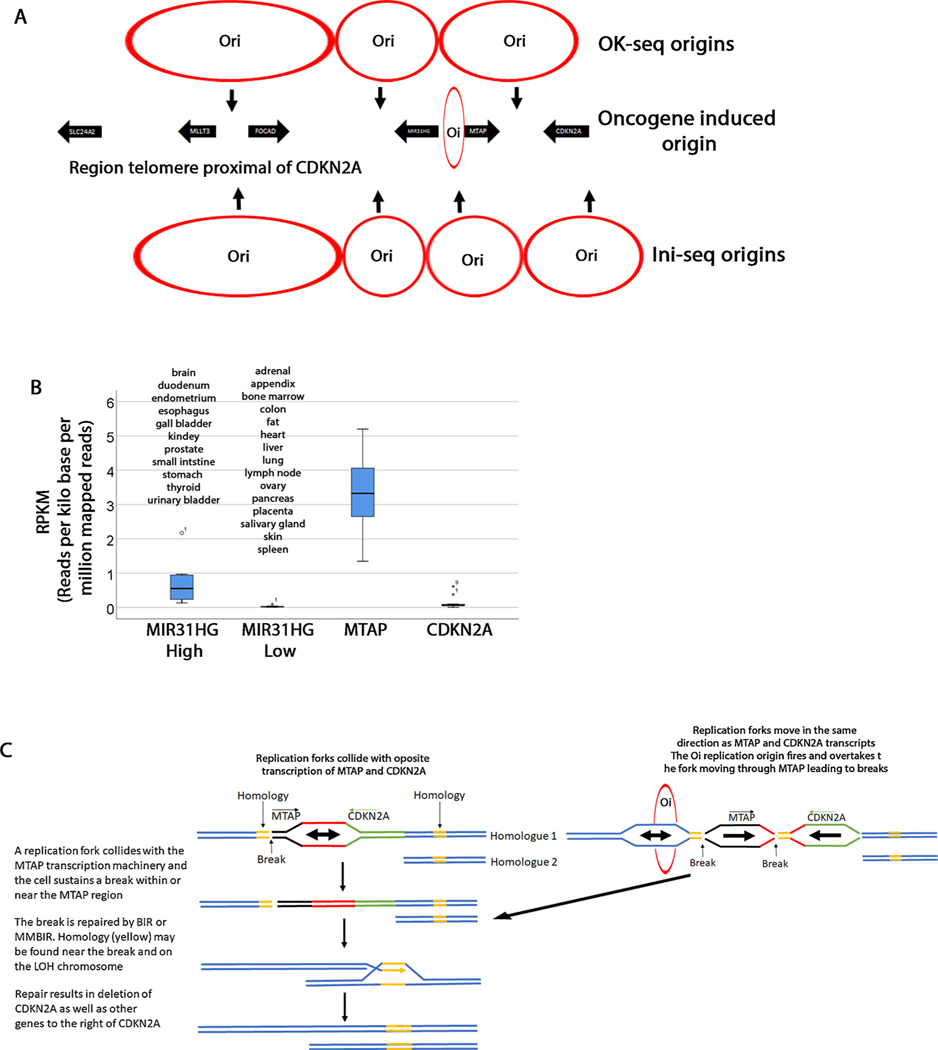
Fig. 4. Speculative model of CDKN2a homozygous deletions.
A. Three origins of replication are shown (OK-seq) that fire at the position of the arrows. Data from Petryk et al. [3]. The replication forks converge where the circles touch. Four origins of replication (Ini-seq) [70] are shown on the bottom of the diagram. An oncogene induced origin is also shown. B. Expression level of MIR31HG, MTAP and CDKN2A from NCBI [46]. MIR31HG is differentially expressed in tissues and this graph groups all tissues with 0.135RPKM as high and those below 0.135RPKM as low. MTAP is ubiquitously expressed and the graph shows expression in all tissues. However, the pancreas has significantly lower expression levels (0.74RPKM) but it is represented in this graph. Although there is some differential expression in various tissues, when compared to MTAP, CDKN2A expression is overall lower (highest expression is 0.6RPKM in fat). C. Model explaining how CDKN2A deletions are generated. In this model we propose that the HDs arise in two steps. In the first step, one of the homologues (Homologue 2) may sustain a deletion (the whole arm or interstitial) leading to a LOH. A second break may occur due to interference between replication forks and MTAP or other genes (MIR31HG, CDKN2A). This break may be repaired by BIR or MMBIR from the LOH homologous chromosome. The outcome is that the CDKN2A and neighboring regions are deleted.

