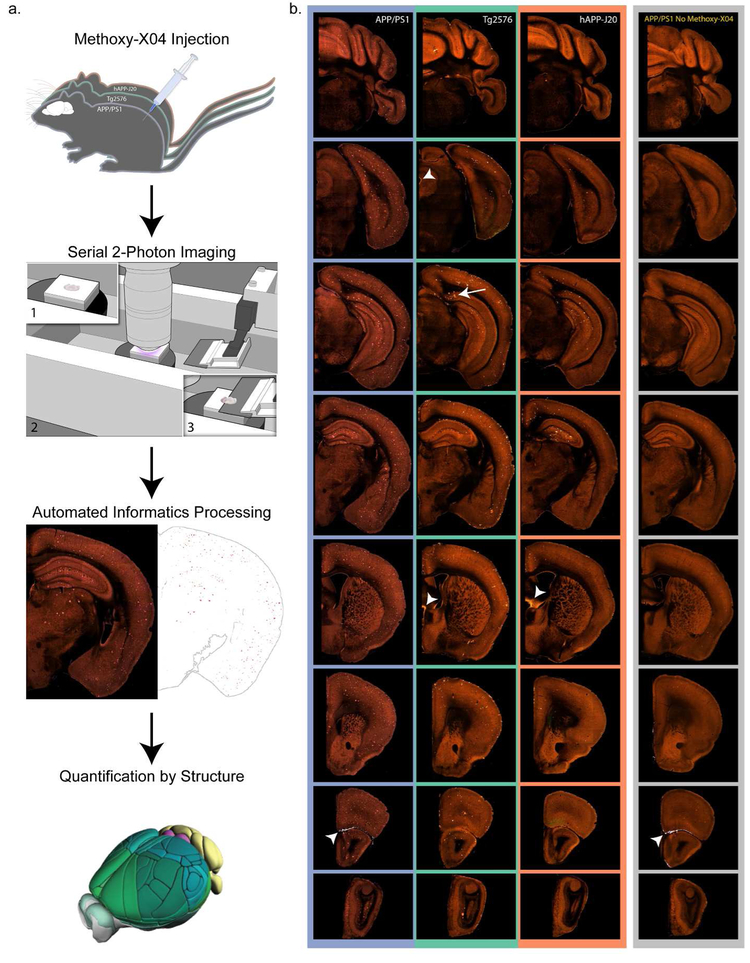
Figure 1. Pipeline workflow for labeling and quantification of brain-wide plaque distribution.
(a) Mice were injected with methoxy-X04 to label plaques in vivo 24 hours before perfusion. Brains were imaged with serial 2-photon tomography which involves embedding the brain in agar (1), acquisition of 2-photon images in the coronal plane (2), and sectioning with an integrated vibratome (3). Images were processed in an automated informatics pipeline that included automated detection of plaques from section images and deformable 3D registration to the Allen CCFv3. Plaque density and count were then quantified for all structures. (b) Selected images from coronal STP image series spanning the brain from cerebellum to olfactory bulb are shown for a 19-month-old mouse with methoxy-X04 labeling from each of the three APP mouse lines used in this study: APP/PS1, Tg2576, and hAPP-J20. Images in the furthest right column show similar sections from a 6-month-old APP/PS1+/− mouse that was not injected with methoxy-X04. Some lower intensity plaque fluorescence is visible without methoxy-X04 labeling. Arrow indicates methoxy-X04 labeled plaques in the subiculum of Tg2576 mice. Arrowheads show examples of bright tissue edges that can cause false positives in automated segmentation.

