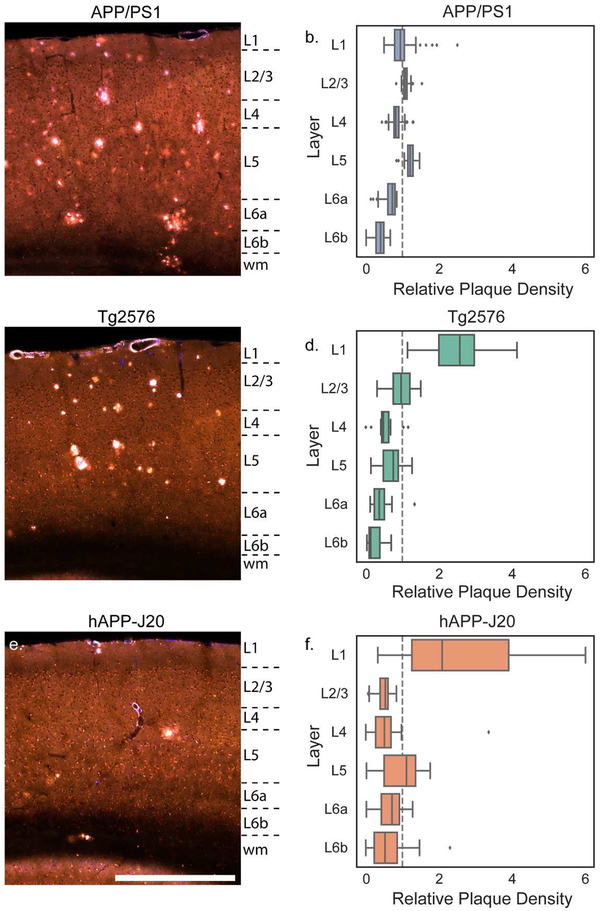
Figure 11. Plaque distribution across cortical layers differs between mouse lines.
Images showing plaques in the parietal cortex of 19-month-old APP/PS1 (a), Tg2576 (b), and hAPP-J20 (c) mice. Approximate layer boundaries are indicated in text to the right of each image (wm = white matter). Scale = 500 μm. The relative plaque density in each cortical layer across the entire isocortex is plotted separately for APP/PS1 (b), Tg2576 (d), and hAPP-J20 (f) mouse lines. Box plots show median and IQR with whiskers extending up to 1.5 times the IQR. Outliers are plotted as individual points.

