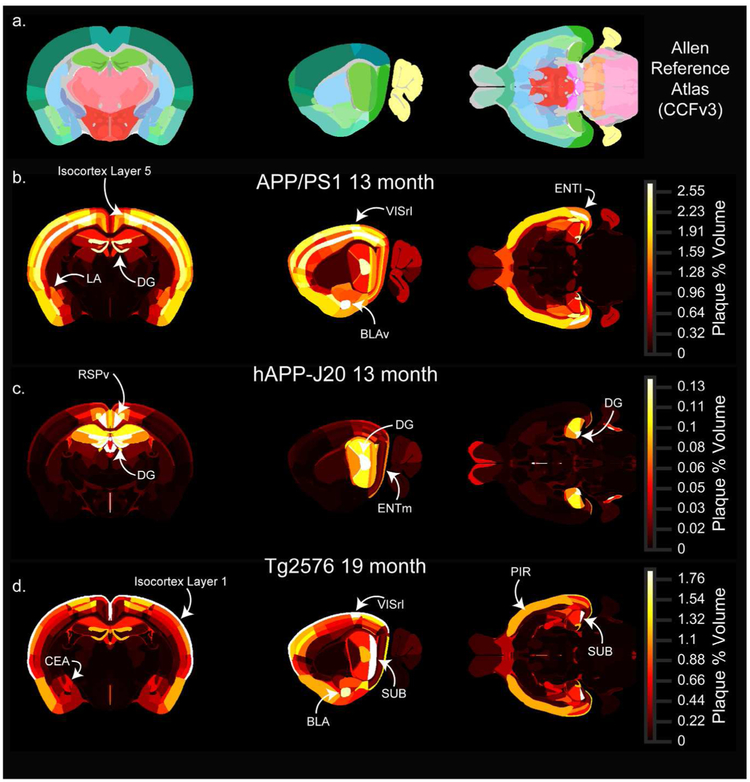
Figure 9. Whole brain 3D heatmaps showing the anatomical distribution of plaques.
Single coronal (left), sagittal (middle), and horizontal (right) planar views from the associated full 3D map for each age-mouse line combination. (a) Sections from the Allen CCFv3 reference atlas showing structure annotation at the summary structure level. (b-d) Single sections corresponding to the reference atlas plates in the top row colored by plaque density. APP/PS1 (b) and hAPP-J20 (c) maps for 13-month-old animals are shown, and the Tg2576 (d) map is for 19-month-old animals. Each plaque map has its own scaled colormap (indicated in color bar on right) since absolute plaque levels are variable between ages and mouse lines. The full 3D plaque maps for all ages and mouse lines are available to download as nrrd files online at [link to be provided]. Abbreviations: LA: Lateral amygdalar nuclus, DG: dentate gyrus, VISrl: rostrolateral visual area, BLAv: Basolateral amygdalar nucleus, ventral part, ENTl: lateral entorhinal cortex, RSPv: ventral retrosplenial cortex, ENTm: medial entorhinal cortex, CEA: Central amygdalar nucleus, SUB: subiculum, BLA: Basolateral amygdala, PIR: Piriform cortex.

