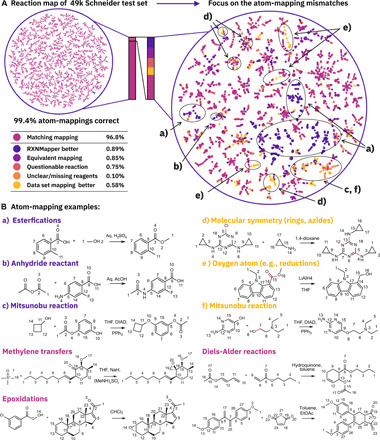
Fig. 2. Reaction map and examples.

(A) Visualizing the results on the whole 49k Schneider test set with a focus on the mismatched atom-mappings (together with 1.5 k matches for context) using reaction tree maps (TMAPs) (41, 58). (B) Examples of atom-mappings generated by RXNMapper. Reactants and reagents were not separated in the inputs.
