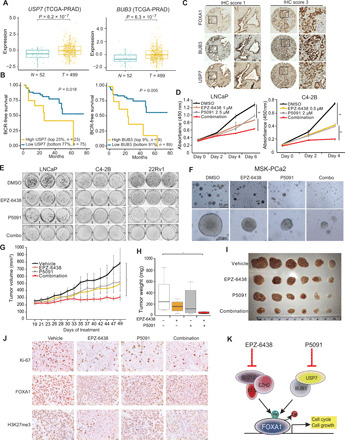
Fig. 7. Therapeutic targeting of FOXA1-driven PCa using EZH2 and/or USP7 inhibitors.

(A) USP7 and BUB3 levels in benign adjacent (N) and localized PCa (T). (B) Kaplan-Meier analyses of patients in the TCGA-PRAD dataset stratified by USP7 and BUB3 expressions. (C) IHC of FOXA1, BUB3, and USP7 was performed in adjacent sections of TMA of primary prostate tumors (n = 110). Shown are representative images with IHC scores of 1 or 3. (D) WST-1 growth assay of PCa cells treated with EZH2 or USP7 inhibitors. Error bars, means ± SEM, n = 3. (E) Colony formation assay of PCa cells treated with DMSO, EPZ-6438 (1 μM in LNCaP and 0.5 μM in C4-2B and 22Rv1), P5091 (3 μM in LNCaP and 2 μM in C4-2B and 22Rv1), or their combination for 2 weeks. (F) Representative images of mitogen- and stress-activated protein kinase (MSK)–PCa2 organoids after 10 days of treatment by DMSO, 10 μM EPZ-6438, 5 μM P5091, or combination. (G to J) C4-2B xenograft growth in nonobese diabetic/severe combined immunodeficient (NOD/SCID) mice received vehicle, EPZ-6438 (200 mg/kg) (twice a day; oral gavage), P5091 (10 mg/kg) (twice a week; intravenous), or both for 30 days (G). Tumor weights were measured at end point (H and I), and sections were stained with indicated antibodies (J). Error bars, means ± SEM, n = 6, and *P < 0.05 by analysis of variance (ANOVA). (K) A model depicting the therapeutic strategies to target FOXA1-driven PCa.
