
Fig. 3. Comparison of latitudinal gradient of acritarch generic diversity and modeled species diversity.
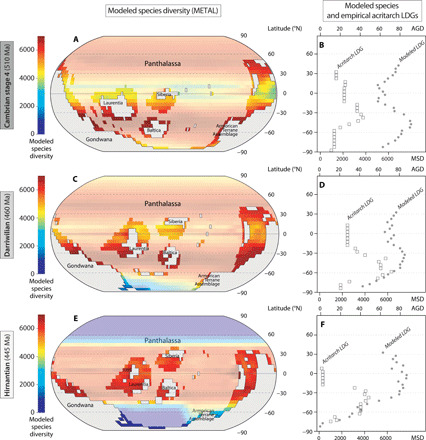
(A and B) Cambrian stage 4 (510 Ma, 32 PAL, i.e., preindustrial atmospheric level of CO2, 1 PAL = 280 parts per million), (C and D) Darriwilian (460 Ma, 12 PAL), and (E and F) Hirnantian (445 Ma, 5 PAL). Modeled spatial distribution of species diversity corresponds to mean results of 1000 METAL simulations for continental shelves (>200 m, bright colors) and ocean surface (<200 m, light colors), based on Scotese and Wright’s (42) maps and SST simulated using the FOAM model, projected on a 5° × 5° spatial grid (A, C, and E) and calculated by 5° latitudinal bands [gray dots on (B), (D), and (F) plots]. Acritarch generic diversity calculated by 5° latitudinal bands [white squares on (B), (D), and (F)] using the range-through counting approach (80, 86). AGD, acritarch generic diversity; MSD, modeled species diversity.