
Fig. 1. 3DFG SEM imaging and optical characterization.
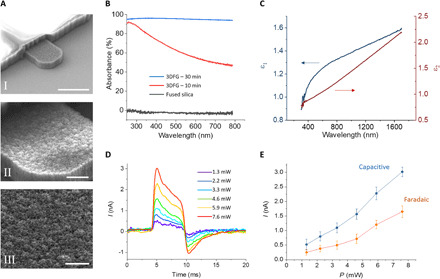
(A) SEM images of 5-μm 3DFG electrodes. Scale bars, 5 μm (I), 1 μm (II), and 0.5 μm (III). (B) UV-vis absorbance as a function of wavelength for fused silica (gray), 3DFG synthesized at 800°C for 10 min (red), and 3DFG synthesized at 800°C for 30 min (blue). (C) Real (ε1) and imaginary (ε2) parts of the dielectric constant of 3DFG in the visible and near-infrared range. (D) Photocurrent generated at the interface between 3DFG electrodes and PBS under excitation with ultrafast (picosecond) pulsed laser at 1064 nm at varying laser intensities. The pulse trains have a duration of 6 ms. (E) Capacitive and faradaic current components of the photocurrent generated by laser excitation. The capacitive values were taken as the maximum current peak at the onset of the laser excitation. The faradaic values were calculated as the average of the last 1-ms-long portion before the end of the laser pulse train.