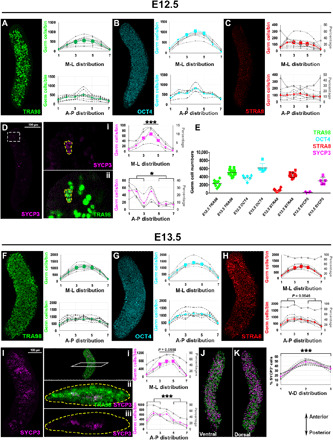
Fig. 2. Earlier meiotic initiation and a new radial meiotic wave in embryonic mouse ovaries.

Detection of TRA98 (A), OCT4 (B), STRA8 (C), and SYCP3 (D) proteins in E12.5 ovaries by wholemount immunofluorescence. Sparse STRA8+ and SYCP3+ cells were identified as early as E12.5. White dashed rectangle in (D) indicates zoom at right. (Di) SYCP3+ meiotic germ cells at E12.5 are delineated by yellow dash with TRA98 stain in (Dii). Graphs show anterior skew of SYCP3+ (P = 0.0404) but not STRA8+ cells [(C); P = 0.8070] at E12.5. More SYCP3+ cells were detected in the medial part (segments 3 to 5) than lateral parts (1, 2, 6, and 7) (P = 0.0002) at E12.5. (E) Quantification of germ cells with each marker at E12.5 and E13.5. Wholemount immunolocalization of TRA98 (F), OCT4 (G), STRA8 (H), and SYCP3 (I) at E13.5. Uptick of STRA8+ and SYCP3+ germ cells was confirmed at E13.5, with STRA8+ cells enriched in the anterior (P = 0.0546). (J) SYCP3+ cells congregated in clusters in the anterior-medial part of the ovary [shown in transverse optical section view in (Ii) to (Iiii)] with significant A-P bias (P = 0.0001), although clusters were also noted near the posterior tip. (J) and (K) show SYCP3+ spots in the ventral and dorsal views of the E13.5 ovary, respectively, with graph showing the highest numbers in the middle segment and increased numbers in the dorsal compared to ventral region (P = 0.0003). Primary y axes (on the left of each graph) indicate germ cell numbers in each bin, dashed lines represent individual ovaries, and color-coded thick lines show mean value for each antibody. Secondary y axes (on the right and colored in gray) present percentage of STRA8 and SYCP3 cells (normalized to total germ cells) in each bin. At least n = 3 ovaries (from two litters and three to four embryos) were analyzed for each time point. ***P < 0.0001.
