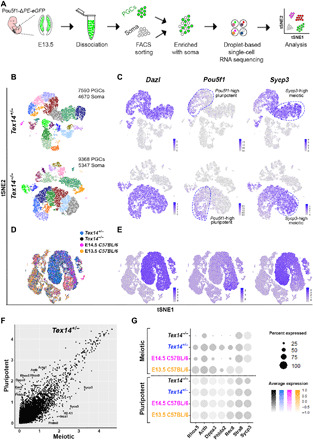
Fig. 5. Dissecting the transcriptional signature of Tex14+/− and Tex14−/− ovaries during the time of meiotic initiation.

(A) Experimental design schematic. (B) Visualization of single-cell clustering by tSNE shows 10 germ cell and 12 somatic cell clusters in Tex14+/− and Tex14−/− ovaries represented by different colors. FACS, fluorescence-activated cell sorting. (C) Expression of germ cell marker Dazl identifies germ cell clusters. Pluripotent germ cells are defined by expression of Pou5f1 transcript; meiotic germ cells are defined by Sycp3 transcript. Dashed lines indicate cells with higher levels of Pou5f1 or Sycp3. (D) Integration of previously published E13.5 and E14.5 C57BL/6 datasets (24) with E13.5 Tex14+/− and Tex14−/− datasets. (E) Dazl identifies germ cell clusters, pluripotent germ cells are defined by expression of Pou5f1, and meiotic germ cells are defined by Sycp3 transcript. (F) Scatter plot of differentially expressed genes between pluripotent and meiotic clusters in Tex14+/−. (G) Dot plot graph of highly expressed genes (Rhox5, Actb, Dppa3, Phlda2, and Rec8) in the pluripotent clusters compared to meiotic clusters in E13.5 C57BL/6, E14.5 C57BL/6, E13.5 Tex14+/−, and Tex14−/− integrated datasets. Dot size indicates percentage of cells expressing the transcript, while colors denote expression level in cells. Expression of genes associated with the pluripotent cluster was the lowest in Tex14 mutant germ cells, whereas expression of meiotic markers Stra8 and Sycp3 was similar in E14.5 C57BL/6, E13.5 Tex14+/−, and Tex14−/−.
