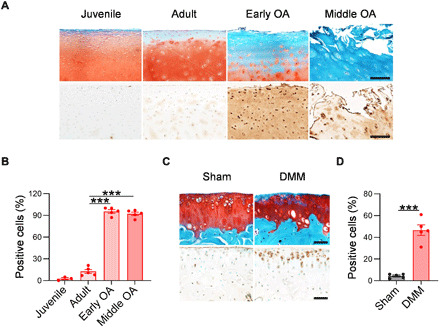
Fig. 1. sPLA2 expression in human and mouse OA cartilage.

(A) Representative images of Safranin O/Fast Green staining (top) and IHC of sPLA2 (bottom) in healthy juvenile, healthy adult, early-stage, and middle-stage human cartilage tissues. Scale bars, 200 μm. (B) Quantification of sPLA2-positive chondrocytes as a proportion of total chondrocytes in healthy and OA human articular cartilage tissues (n = 5). (C) Representative images of Safranin O/Fast Green staining (top) and IHC of sPLA2 (bottom) in the tibial articular cartilage of WT mice at 1 month after sham or after DMM surgery. Scale bars, 50 μm. (D) Quantification of sPLA2-positive chondrocytes in the tibial articular cartilage of sham- or DMM-operated joints (n = 5). Statistical analysis was performed using one-way analysis of variance (ANOVA) with Dunnett’s post hoc test for (B) and paired two-tailed t test for (D). Data presented as means ± SEM. ***P < 0.001.
