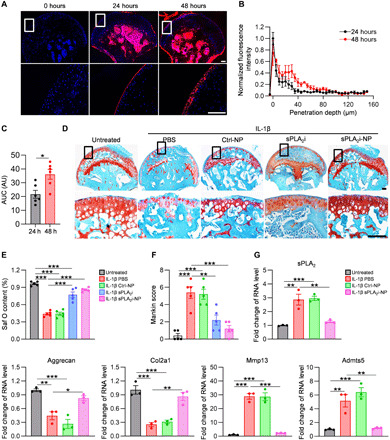
Fig. 4. Penetration and chondroprotective effects of sPLA2i-NPs in mouse femoral heads.

(A) Representative fluorescence images of cross sections of mouse femoral heads stimulated with recombinant mouse IL-1β and incubated with rhodamine-labeled sPLA2i-NPs for 0, 24, or 48 hours. Bottom: Magnified images of the white boxed areas. Scale bars, 100 μm. (B) Semiquantitative analysis of rhodamine-labeled sPLA2i-NPs penetration depth into IL-1β–stimulated mouse femoral heads (n = 6). (C) Quantification of the AUC based on the fluorescence intensity profiles in (B) (n = 6). (D) Representative images of Safranin O/Fast Green staining on the sections of untreated and PBS-, Ctrl-NP–, sPLA2i-, and sPLA2i-NP–treated IL-1β–stimulated mouse femoral heads. Bottom: Magnified images of the black boxed areas. Scale bars, 100 μm. (E) Safranin O (Saf O)–positive area among the above groups was quantified (n = 5). (F) The OA severity was accessed by Mankin score (n = 5). (G) The relative gene expression of sPLA2-IIA, aggrecan, Col2a1, Mmp13, and Adamts5 was examined by quantitative reverse transcription polymerase chain reaction (PCR) in the untreated and PBS-, Ctrl-NP–, and sPLA2i-NP–treated IL-1β–stimulated mouse femoral heads (n = 3). Statistical analysis was performed using paired two-tailed t test for (C) and one-way ANOVA with Turkey’s post hoc test for (E), (F), and (G). Data presented as means ± SEM. *P < 0.05, **P < 0.01, and ***P < 0.001.
