
Fig. 5. Therapeutic effects of sPLA2i-NPs for attenuation of DMM-induced chronic OA.
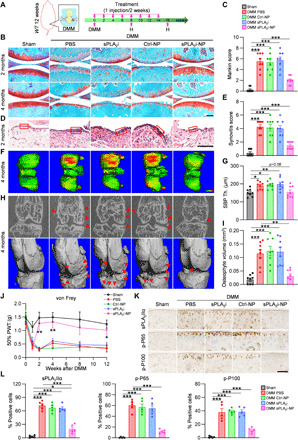
(A) The study design of sPLA2i-NP treatment for DMM-induced OA mice. (B) Safranin O/Fast Green staining of sham- or DMM-operated knee joints with 2 or 4 months of treatment. Scale bar, 200 μm. (C) The OA severity was accessed by Mankin score at 2 months after surgery (n = 8). (D) Hematoxylin and eosin (H&E) staining of synovium tissue at 2 months after surgery. Scale bar, 100 μm. Red boxed areas indicate the synovial lining layer. (E) Synovial inflammation was evaluated (n = 8). (F) 3D color maps of femoral SBP thickness at 4 months after surgery. Color ranges from 0 μm (blue) to 320 μm (red). (G) Quantification of SBP thickness (Th.) at the medial posterior site (n = 8). (H) Osteophytes (red arrows) were revealed by 2D (top) and 3D (bottom) micro–computed tomography (micro-CT) images. (I) Osteophyte volume was quantified (n = 8). (J) von Frey assay was performed at 1, 2, 4, 8, and 12 weeks after surgery (n = 8). The data of day 0 were acquired before surgery. PWT, paw withdrawal threshold. (K) IHC staining of the tibial articular cartilage at 2 months after surgery. Scale bar, 100 μm. (L) Quantification of sPLA2-IIa–, p-P65–, and p-P100–positive chondrocytes (n = 5). Statistical analysis was performed using one-way ANOVA with Turkey’s post hoc test. Data presented as means ± SEM. *P < 0.05, **P < 0.01, and ***P < 0.001 in (C), (E), (G), (I), and (L). *P < 0.05 and **P < 0.01 for sPLA2i-NPs versus PBS in (J).