
Fig. 3. GAT2 deficiency lowers IL-1β secretion through hypoxanthine.
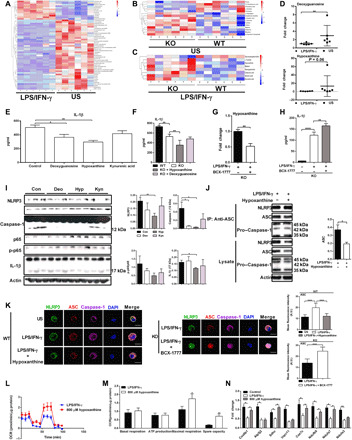
(A to C) Different metabolites in WT resting/proinflammatory macrophages (A), WT/KO resting macrophages (B), and WT/KO proinflammatory macrophages (C) (n = 6). (D) Intracellular deoxyguanosine and hypoxanthine in WT macrophages (n = 6). (E and F) IL-1β secretion from WT (E)/KO (F) proinflammatory macrophages with deoxyguanosine (5 μM), hypoxanthine (8 μM), and kynurenic acid (500 μM) supplementation (n = 3). (G and H) Intracellular hypoxanthine (G) and IL-1β secretion (H) in proinflammatory KO macrophages with 10 μM BCX-177 treatment (n = 6). (I) Protein abundance of inflammosome in WT proinflammatory macrophages treated as (E) (n = 3). (J) Immunoblot analysis of ASC immunoprecipitates in proinflammatory WT macrophages with hypoxanthine (800 μM) treatment (n = 3). (K) Confocal microscopy of proinflammatory WT macrophages with hypoxanthine (800 μM) treatment (left) and proinflammatory KO macrophages with BCX-1777 (10 μM) treatment (right) (n = 3). Scale bars, 10 μm. (L to N) The mitochondrial respiration [(L and M) n = 10] and relative mRNA expressions of OXPHOS-related genes [(N) n = 3] in WT proinflammatory macrophages with hypoxanthine (800 μM) supplementation. Results represent two (E, F, H to J, and L to N) or four [(G) means ± SEM] independent experiments. Data were analyzed by unpaired t test (D to G and J) or two-way analysis of variance (ANOVA) with Bonferroni correction (H, M, and N) and represented as means ± SD unless indicated. *P < 0.05, **P < 0.01, and ****P < 0.0001.