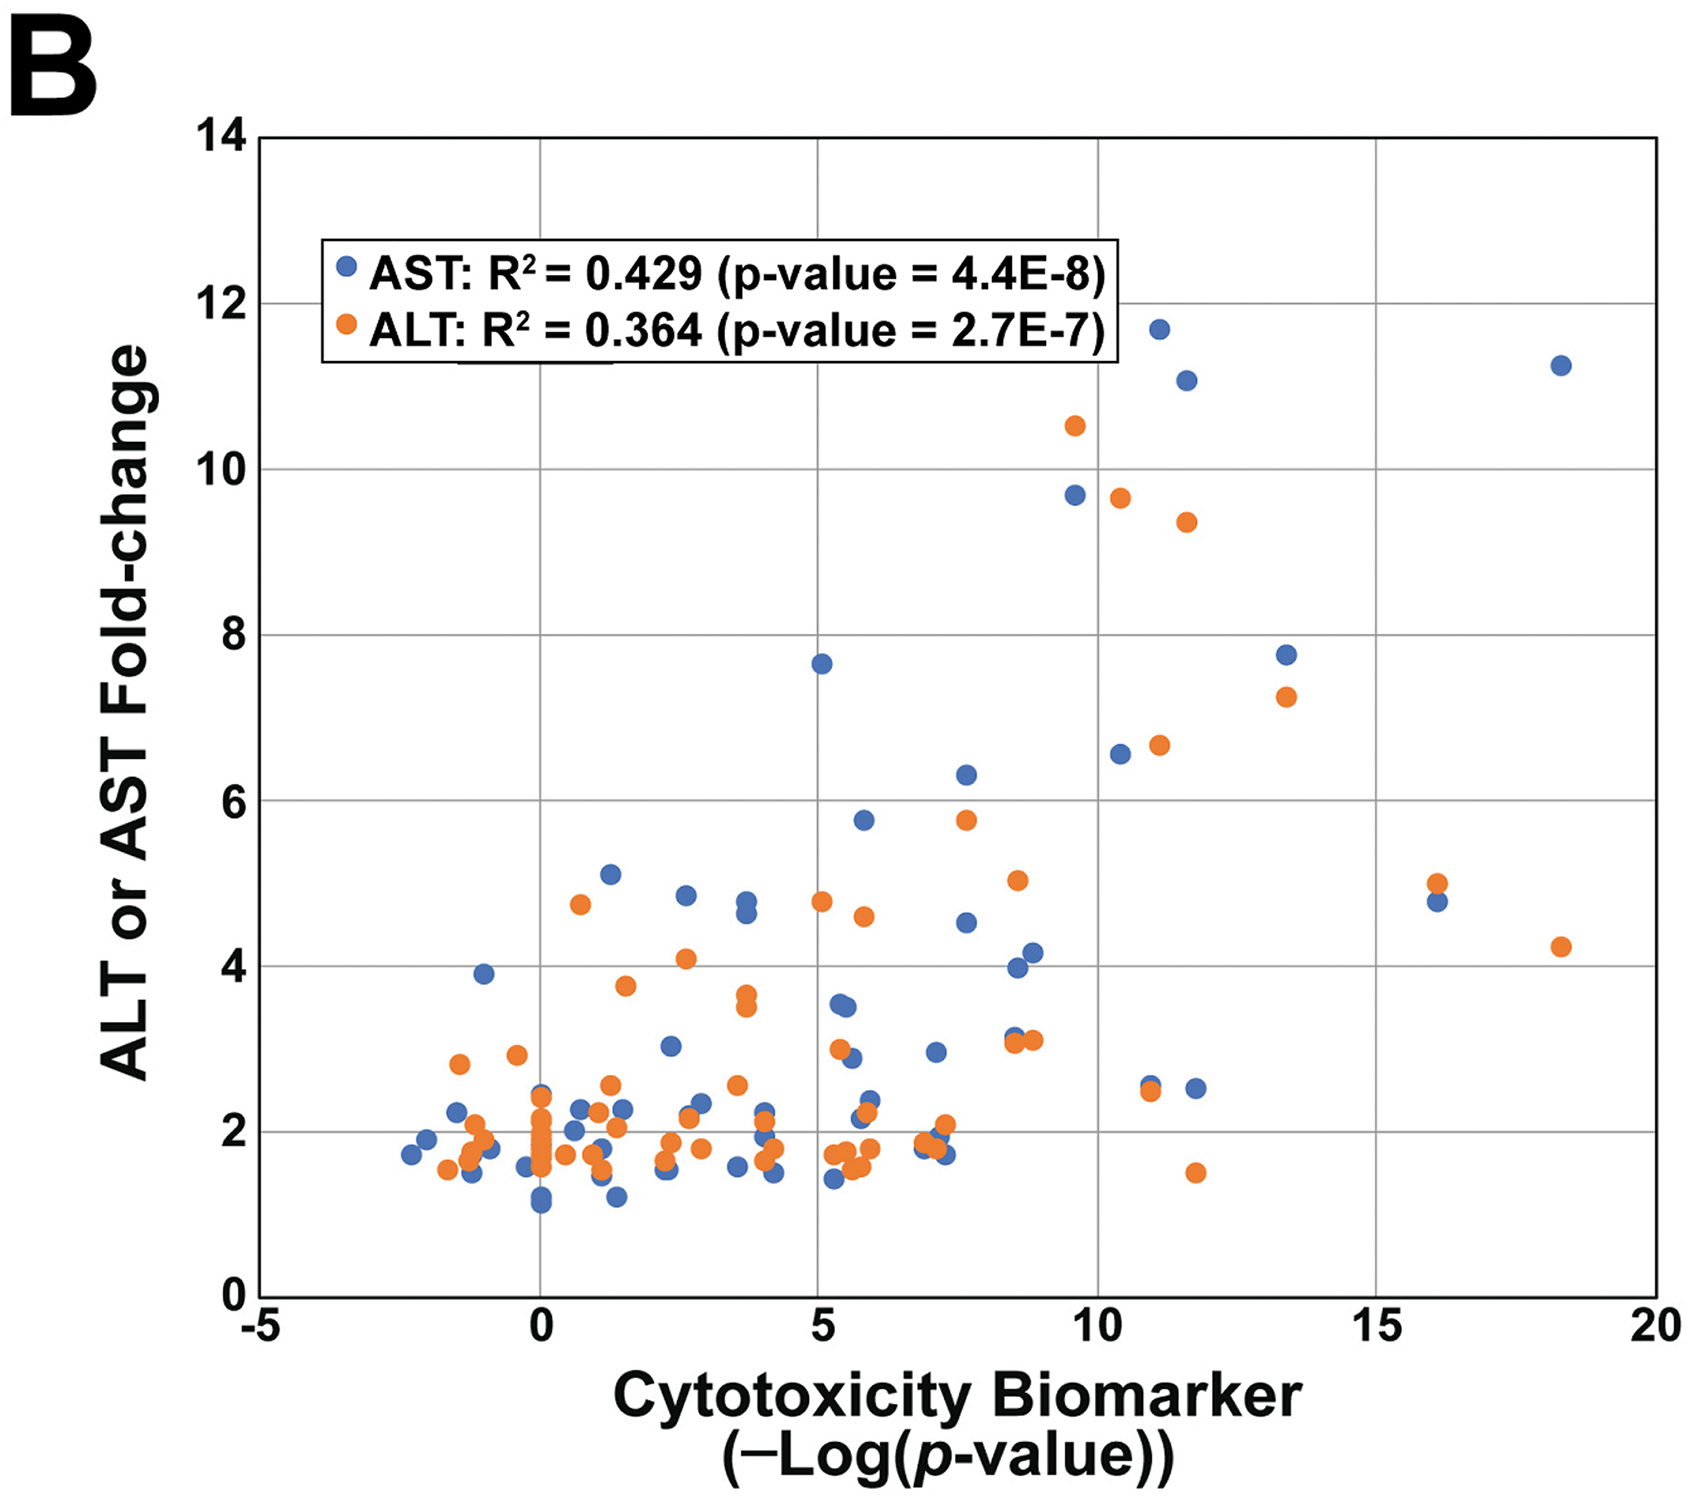
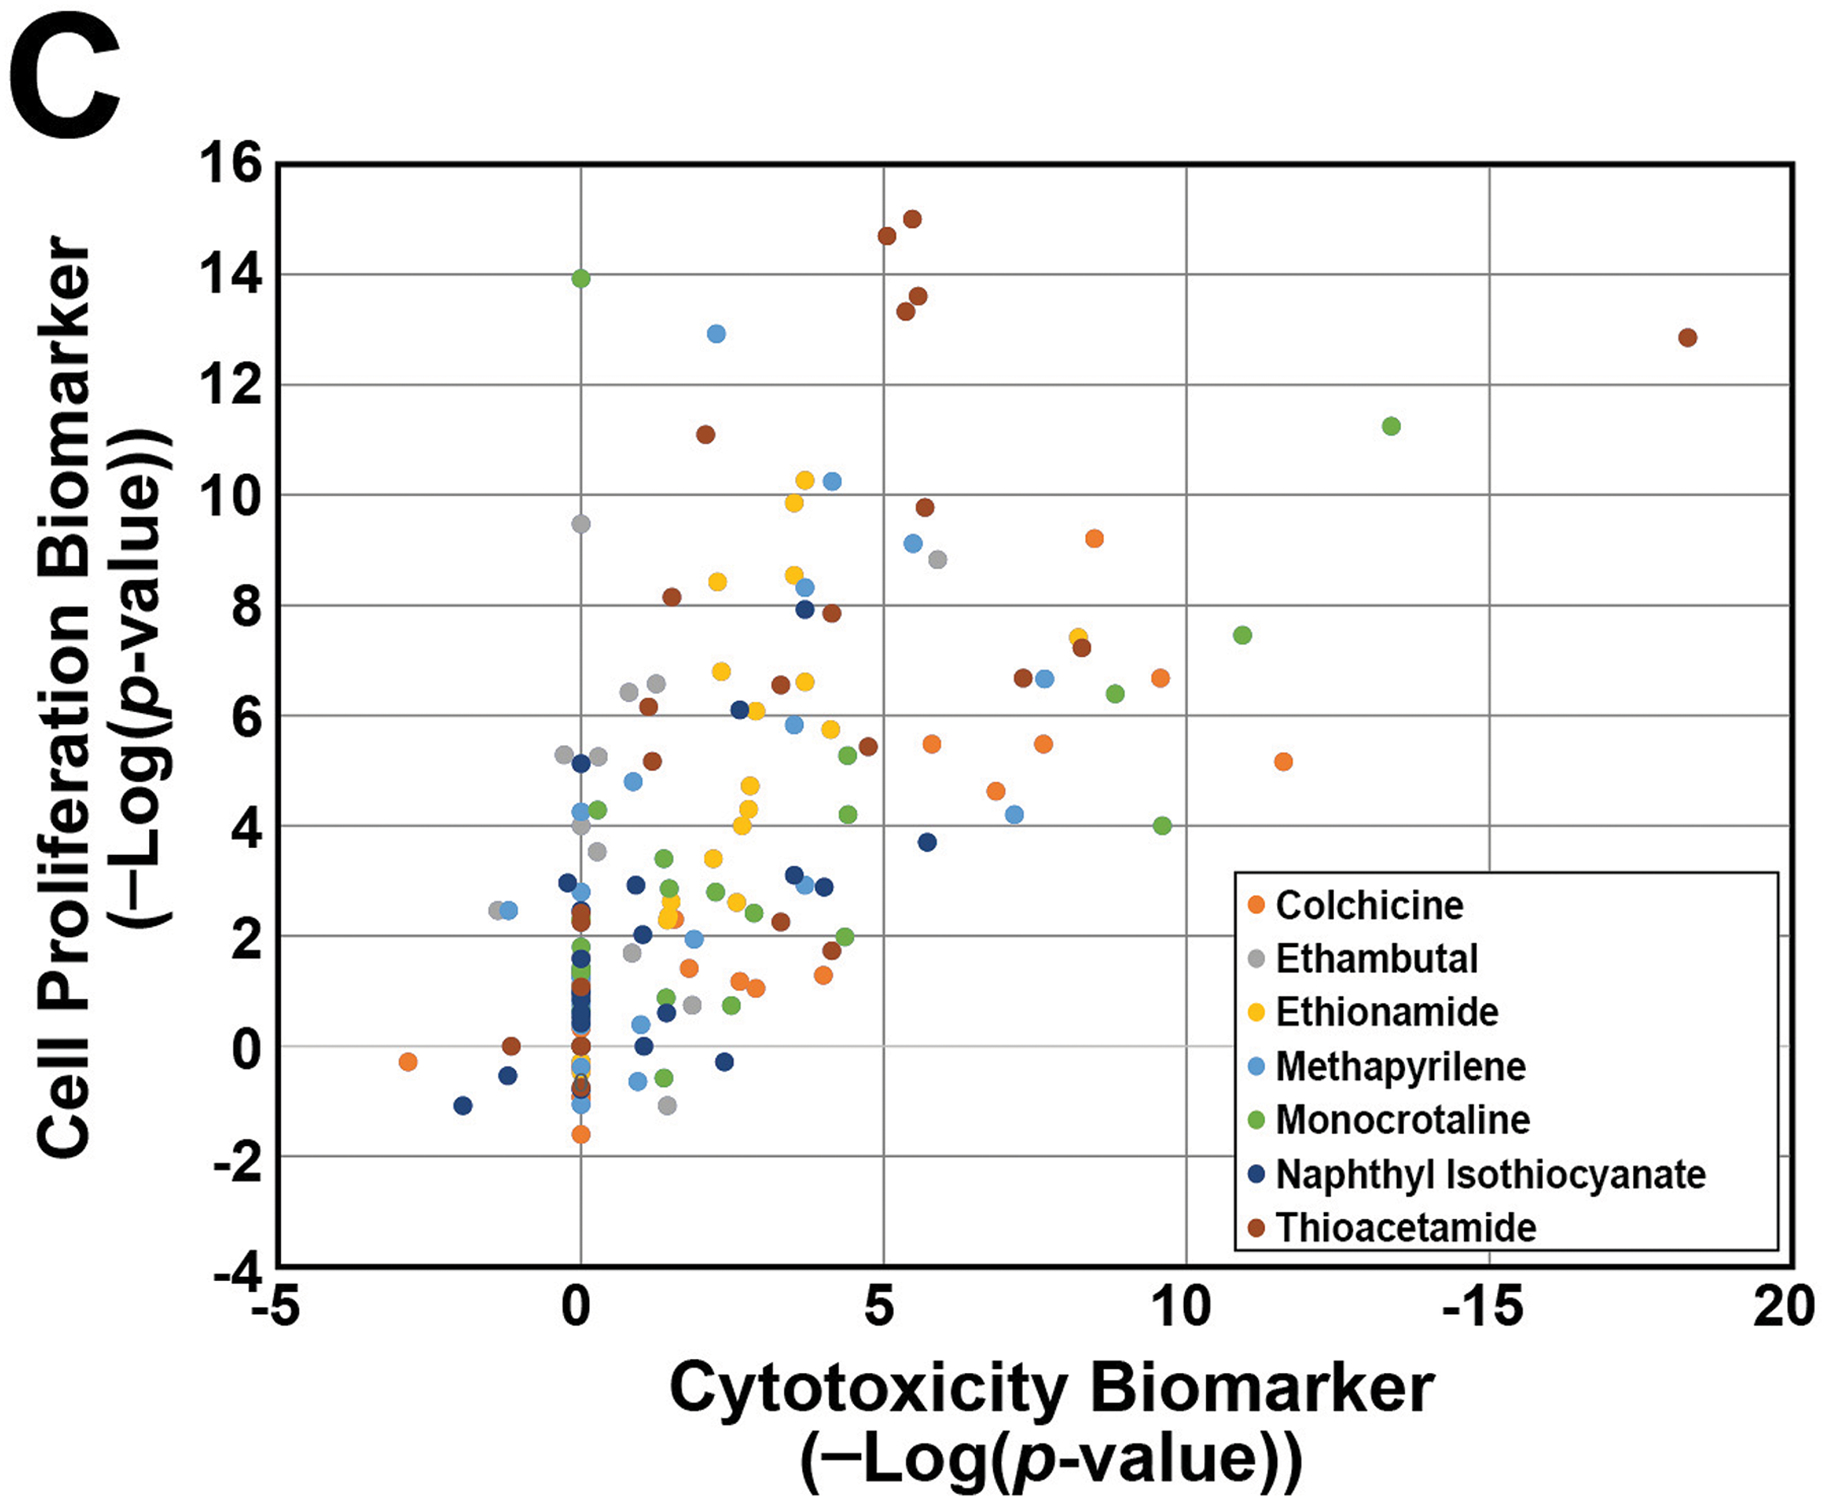
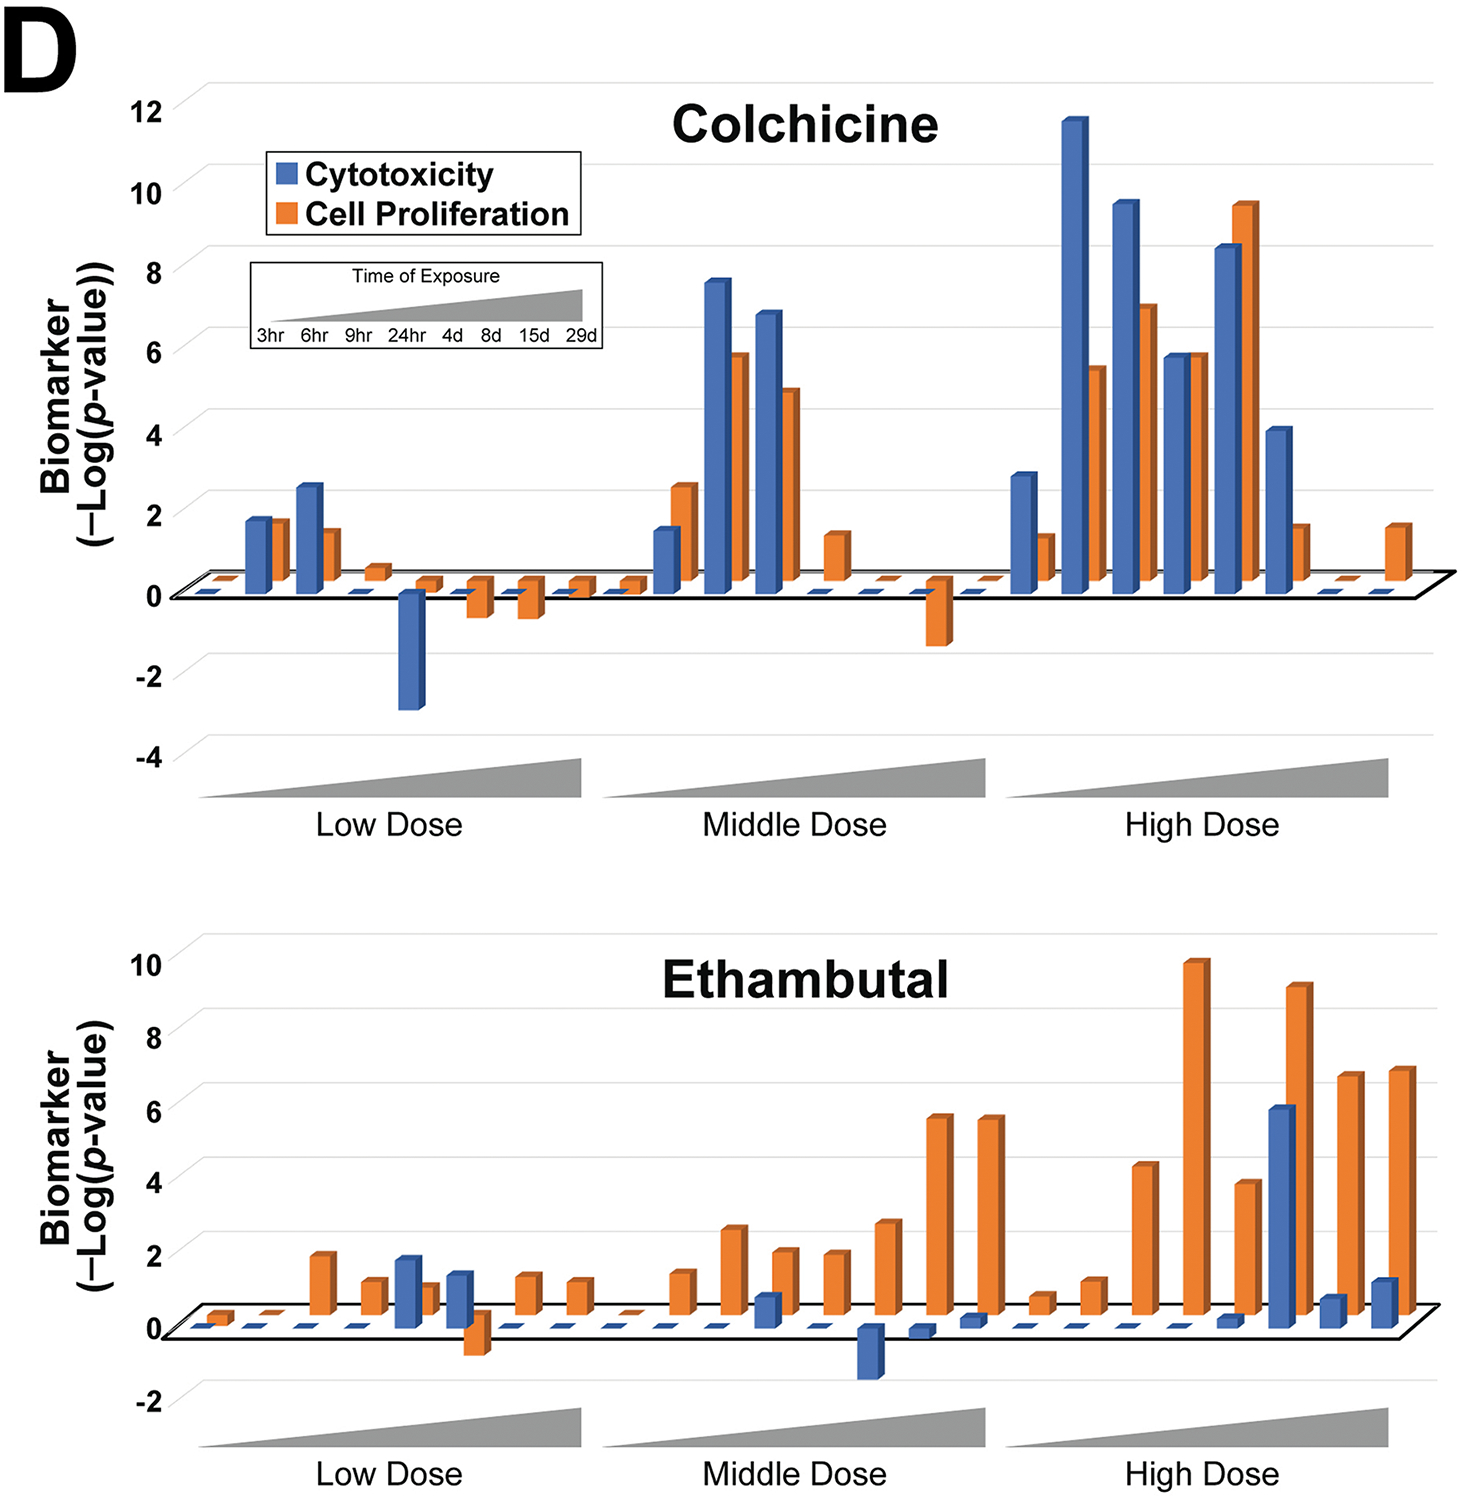
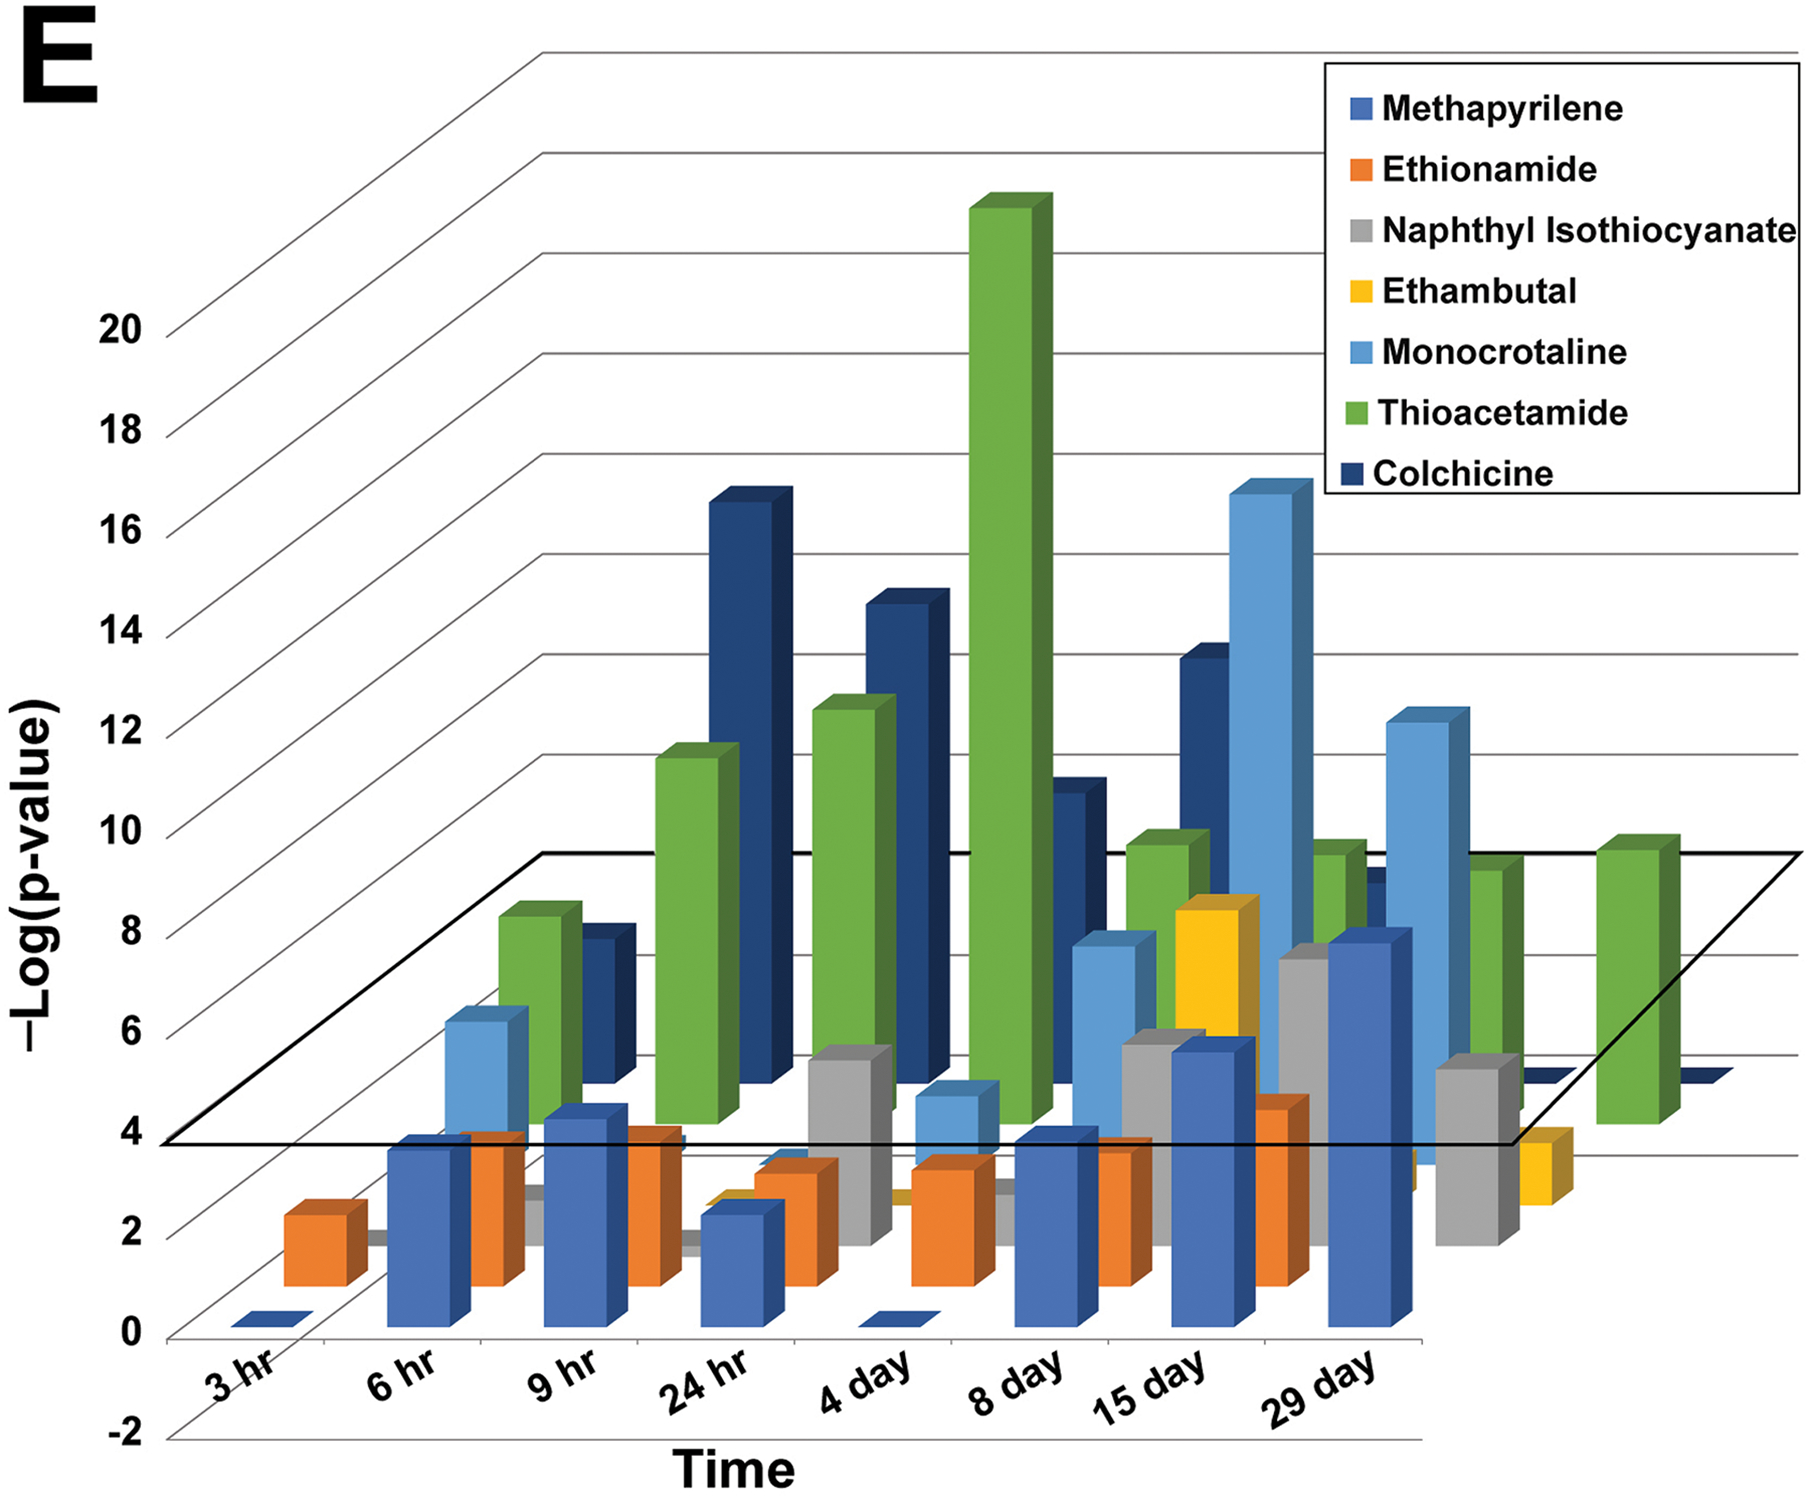
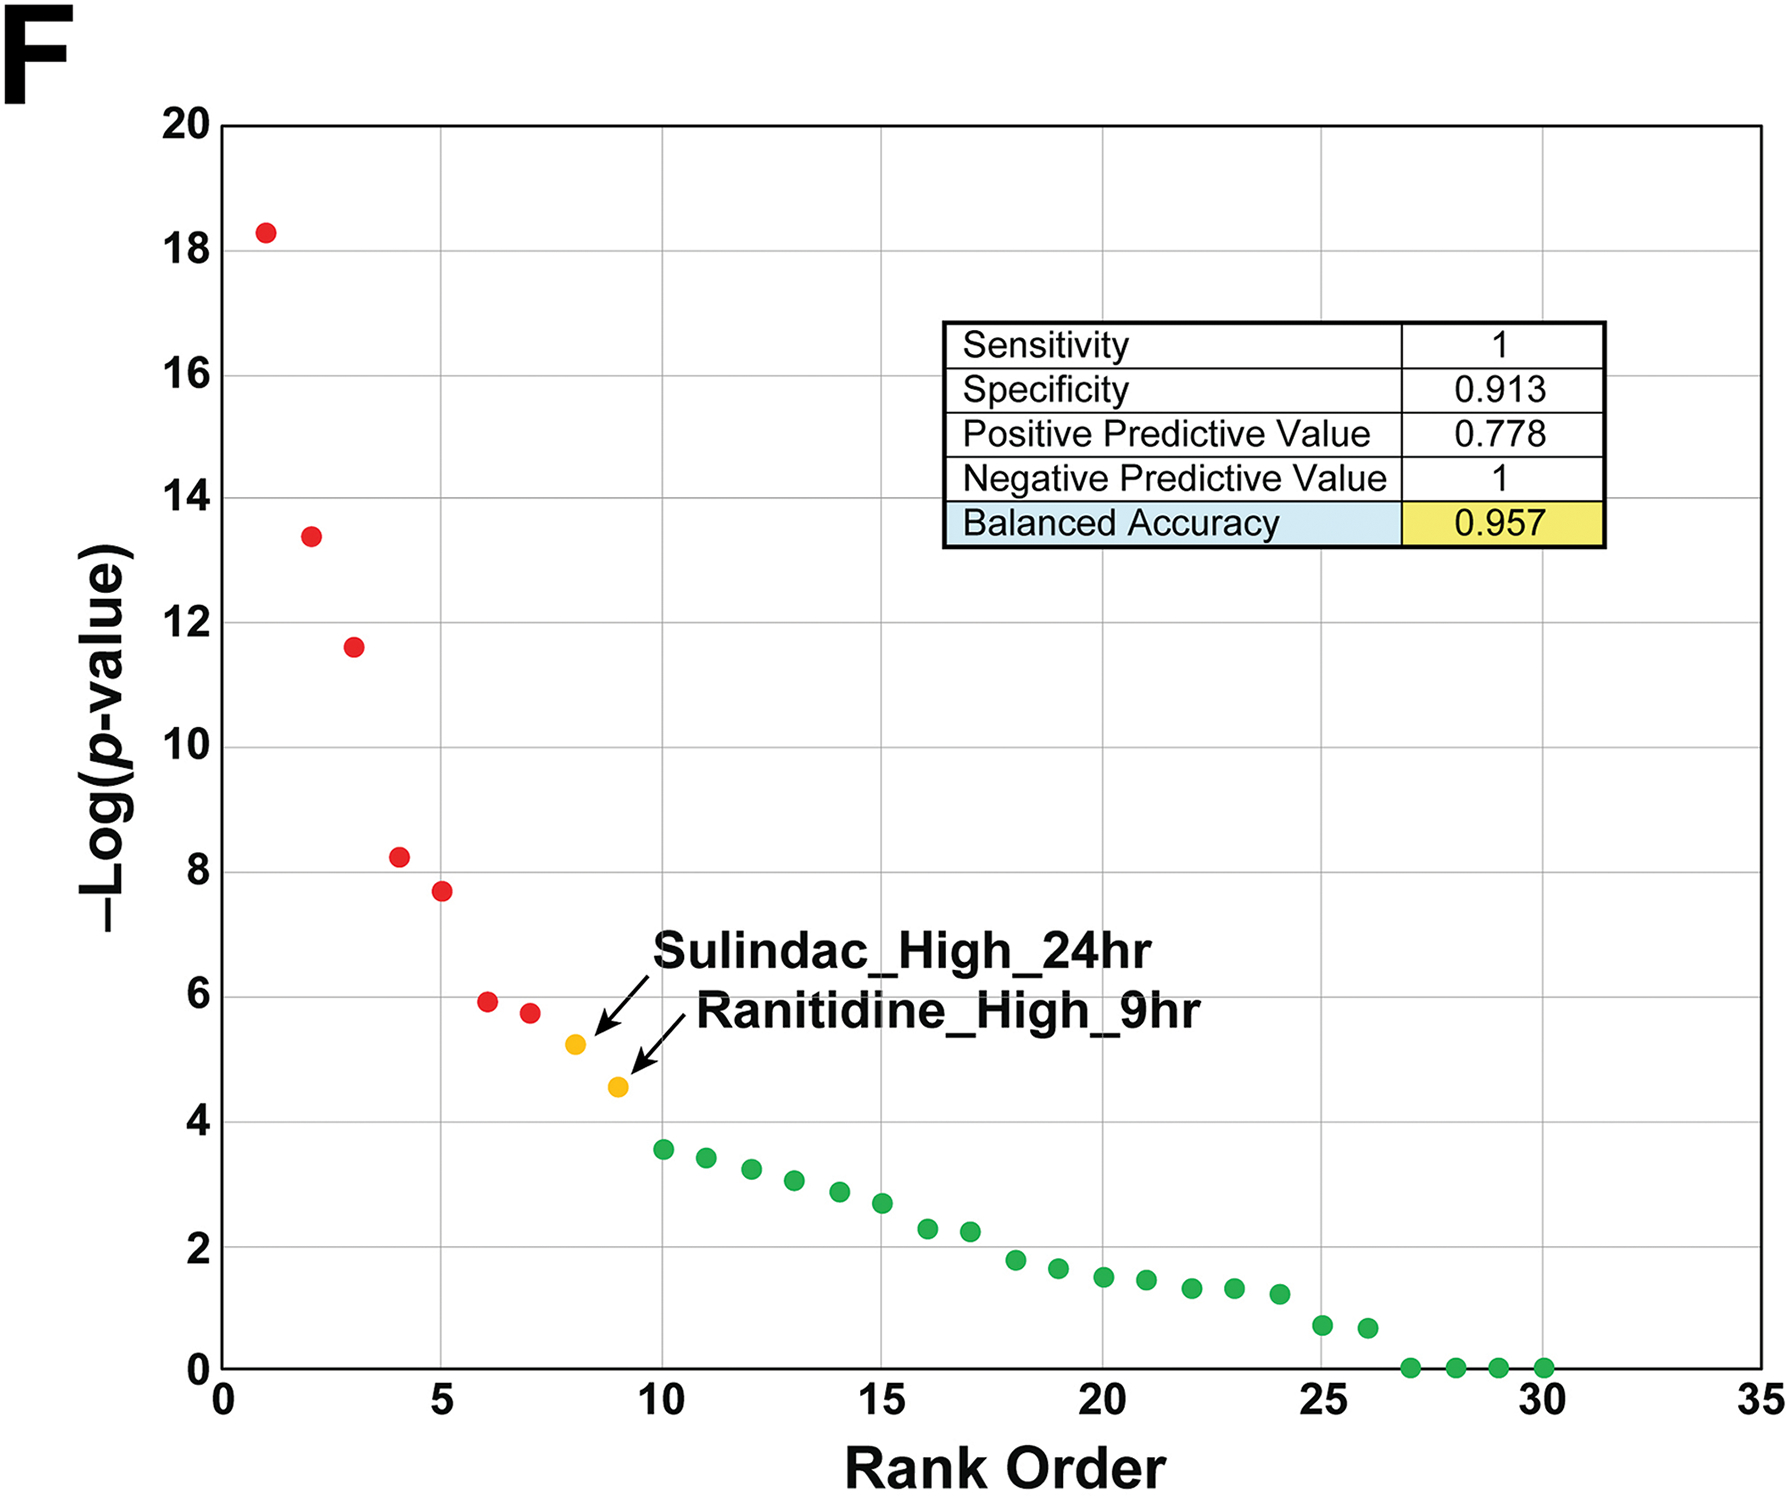
Fig. 2. Characterization of a cytotoxicity biomarker.
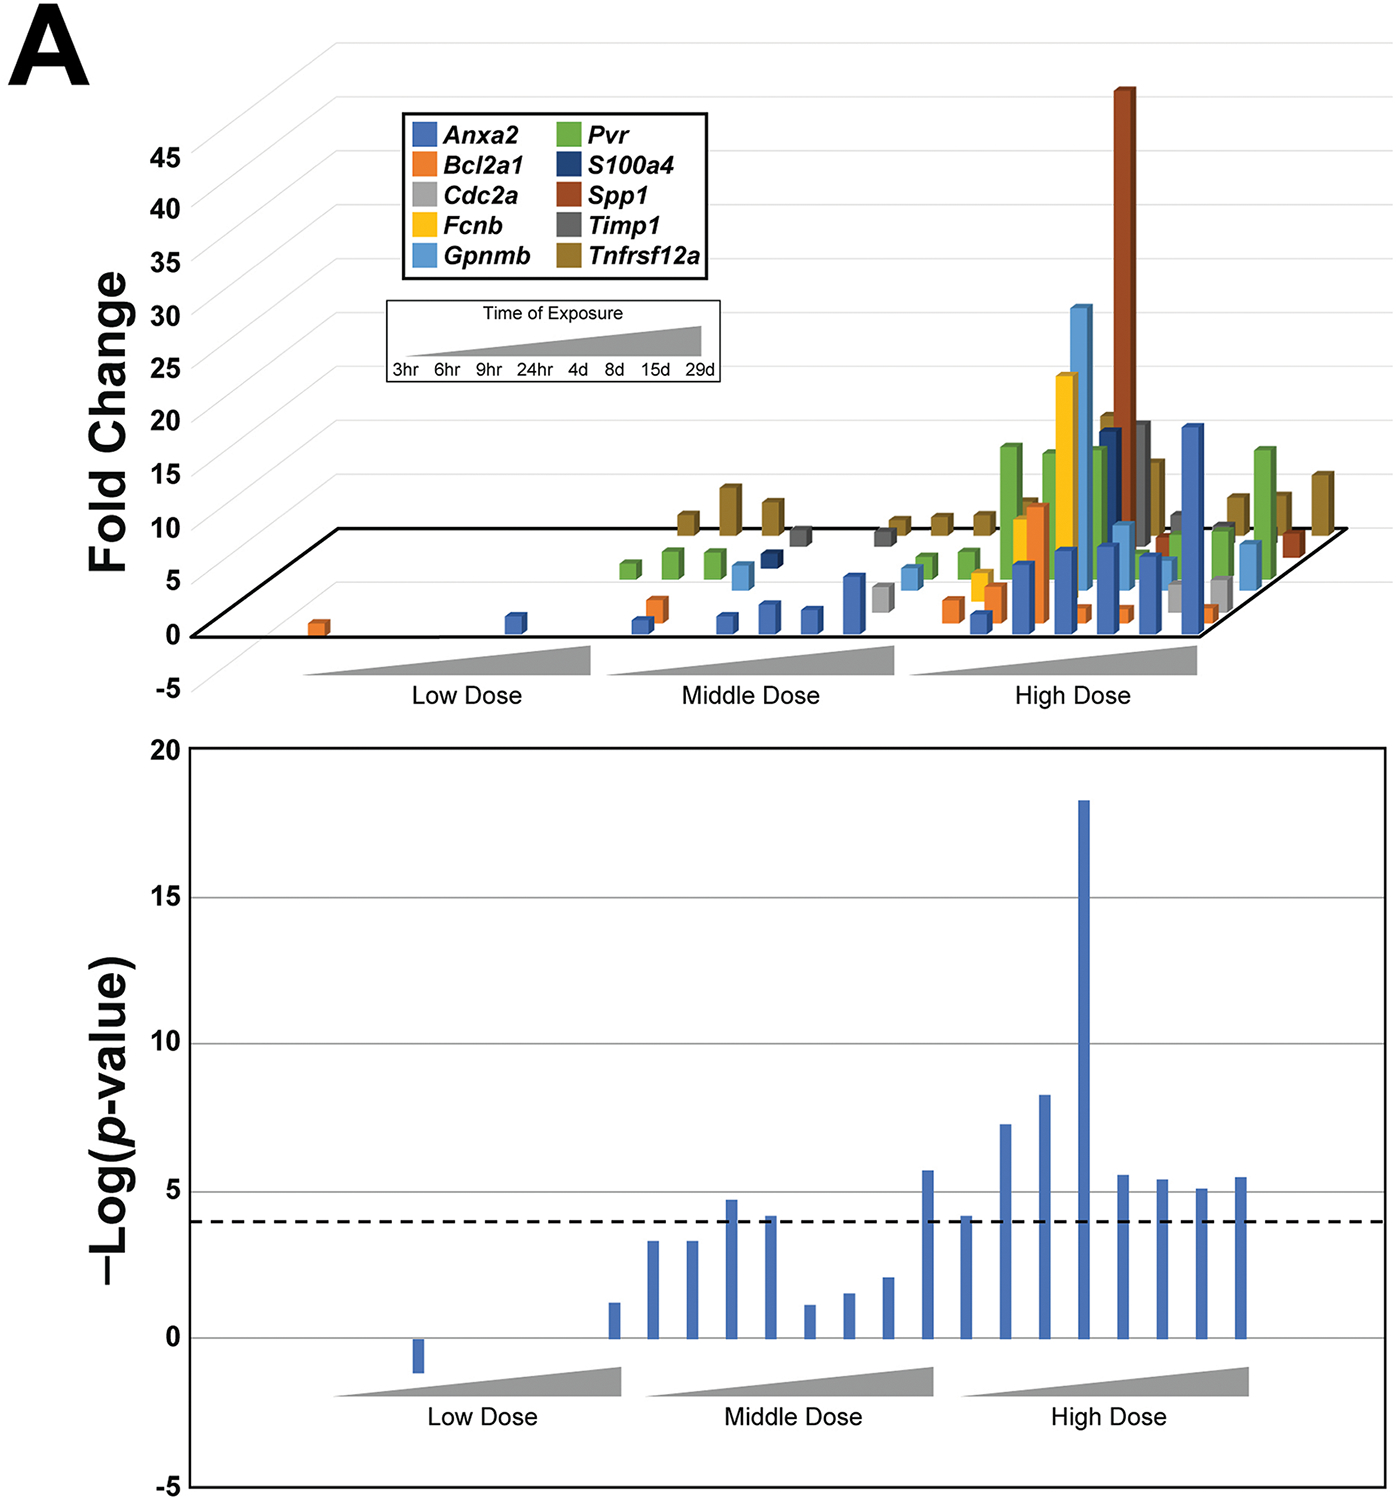
A. Activation of cytotoxicity biomarker genes by thioacetamide. (Top) The expression changes of the 10 genes in the cytotoxicity biomarker are shown across increasing time and dose. Only significant changes in gene expression are shown (p-value < 0.05). (Bottom) The significance of the correlation (in -Log(p-value)s) between the cytotoxicity biomarker and the gene expression changes of each time-dose pair is shown. The cutoff of -Log(p-value) = 4 is shown.
B. Relationship between alterations of ALT/AST and the cytotoxicity biomarker. Biosets in the TG-GATES study were filtered for those with significant increases in ALT or AST and then compared to the biomarker -Log(p-value) for that same treatment.
C. Relationship between correlations with the cytotoxicity and cell proliferation biomarkers for biosets from treatments with 7 cytotoxic chemicals. The transcript profiles of treatment groups in the TG-GATES study selected as described in the Methods were compared to the two biomarkers.
D. Correlations between the transcript profiles from exposure to colchicine (top) or ethambutal (bottom) and either the cytotoxicity or cell proliferation biomarkers across time and dose. The results of a linear regression analysis of each chemical are as follows: colchicine (R2 = 0.800, p-value = 4.13E-09) and ethambutal (R2 = 0.159, p-value = 0.054).
E. Comparison of correlations to the cytotoxicity biomarker for the 7 true positive chemicals. The cytotoxicity biomarker was compared to each of the indicated chem-time comparisons across the highest dose used. The chemicals were ordered to facilitate observing the maximum correlation with the chemicals. There were no values for the 29d timepoint for ethionamide and monocrotaline.
F. Predictive accuracy of the cytotoxicity biomarker. The biomarker was compared to transcript profiles of chemicals that are known positives (7) or negatives (23) for cytotoxicity. See Methods for criteria for selection of chemicals. The -Log(p-value) for each chemical represents the highest value within all of the time-dose pairs found in the TG-GATES study. A summary of the prediction sensitivity and specificity of the cytotoxicity biomarker is shown. The two false positives are shown that caused significant correlation to the biomarker.
