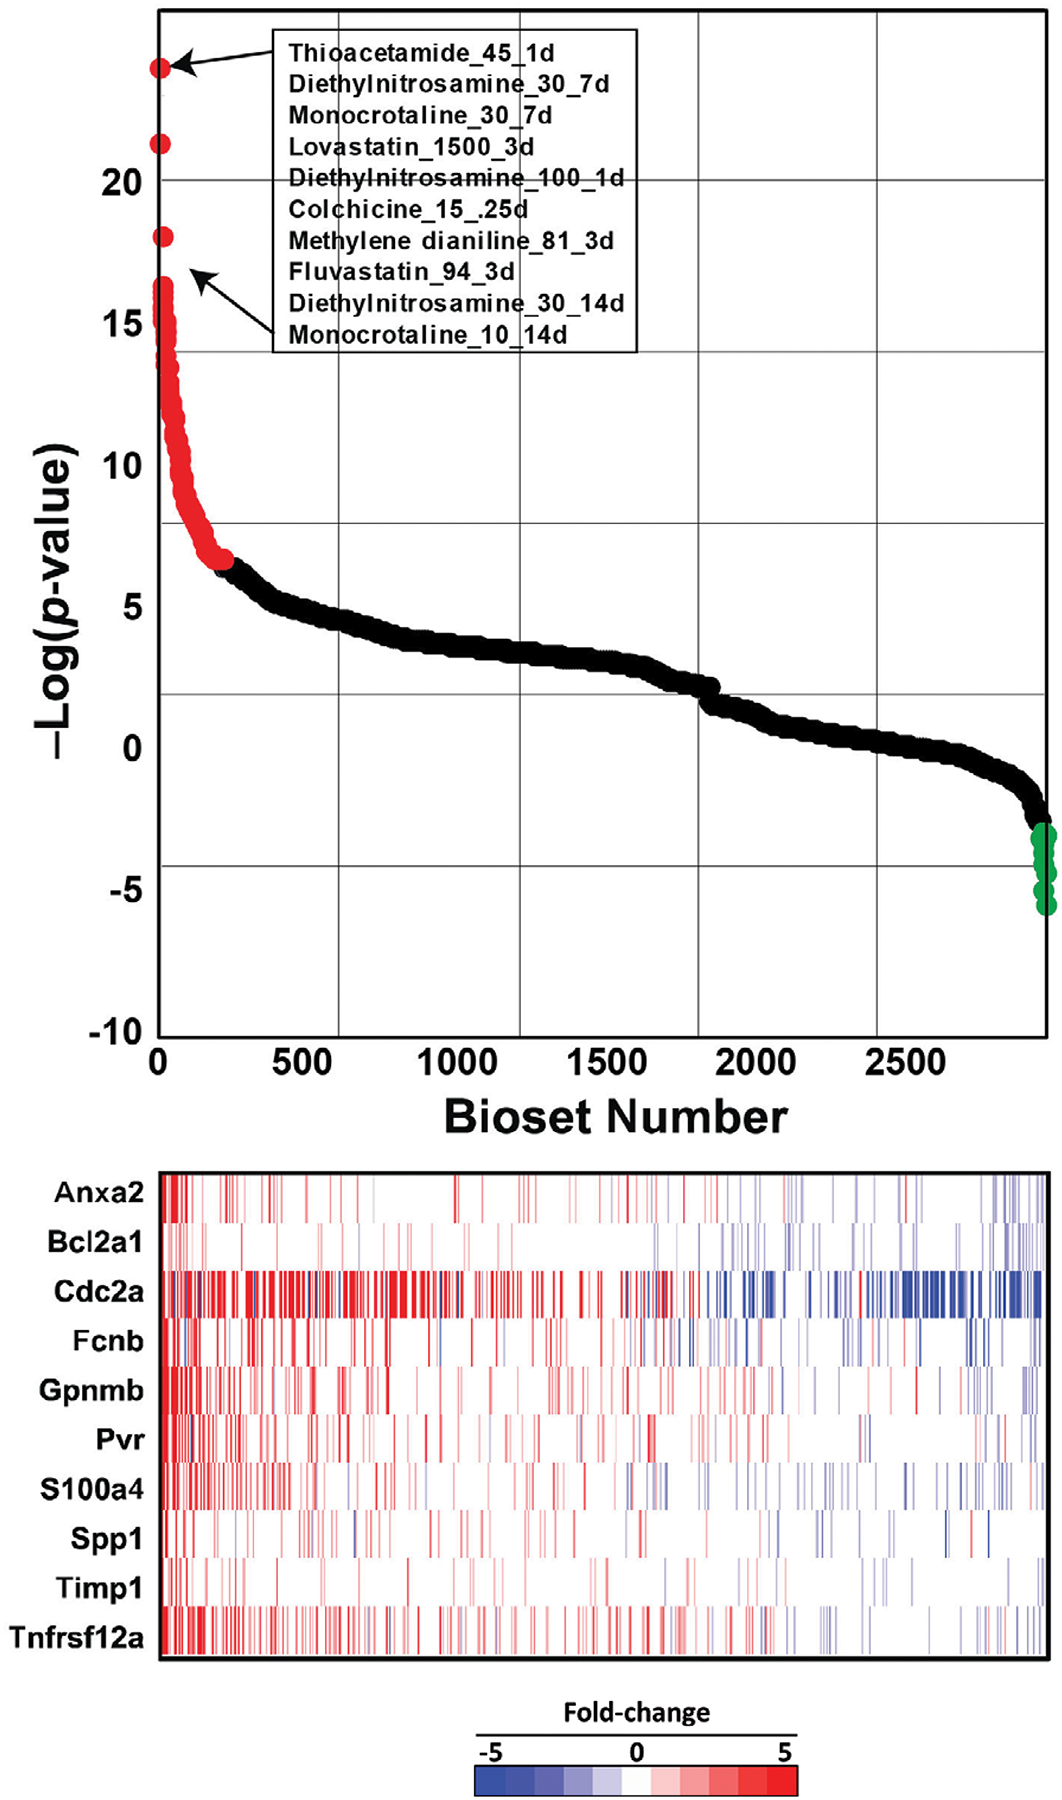
Fig. 3. Screening for cytotoxicants in a rat liver microarray compendium.

All 4745 transcript profiles representing chemical exposures in the microarray compendium were compared to the cytotoxicity biomarker using the Running Fisher test. (Top) The series of points represents the rank ordered -Log(p-value)s of the biosets compared to the biomarker. Biosets with positive correlation are on the left, and if the -Log(p-value) ≥ 4, they are indicated in red. The biosets with negative correlations are on the right and if the -Log(p-value) ≤ −4, they are indicated in green. Biosets with a -Log(p-value) = 0 are not shown. The top 10 most positively correlated biosets are shown and are represented as dose in mg/kg/day and time of exposure in days. (Bottom) The heat map shows the expression of the 10 biomarker genes in the corresponding biosets.
