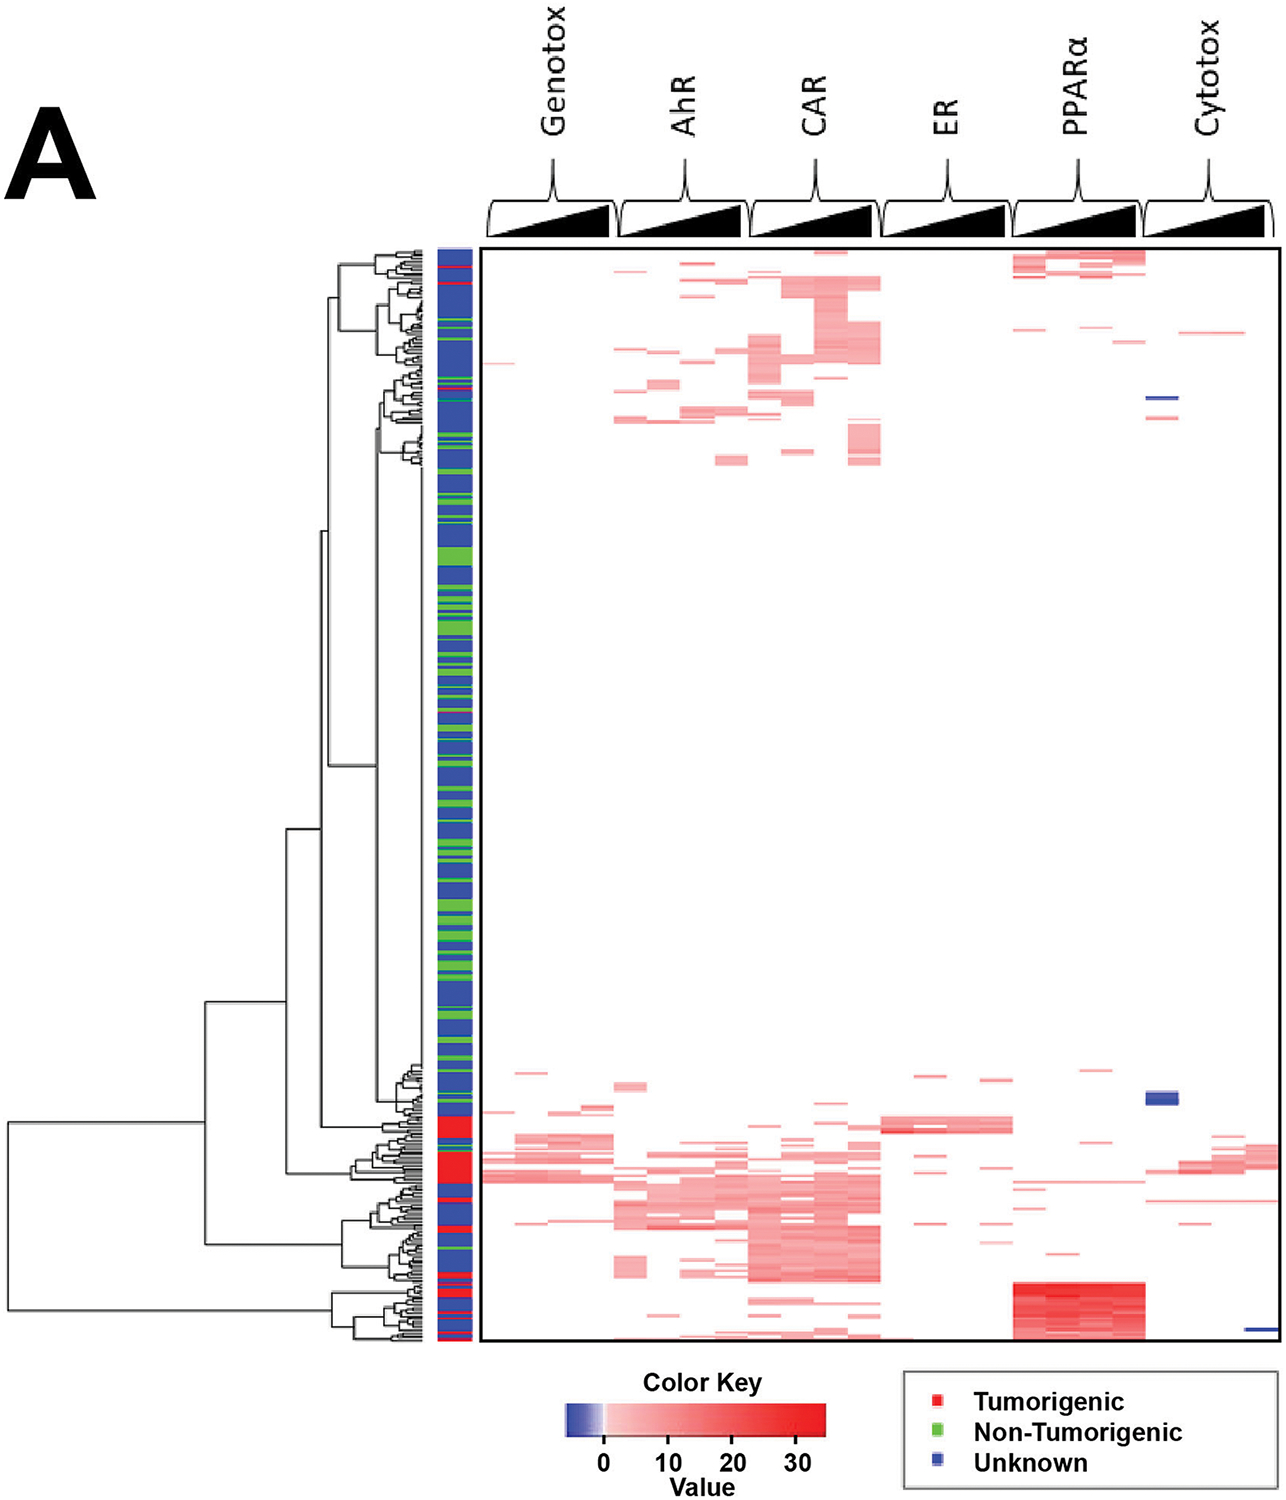
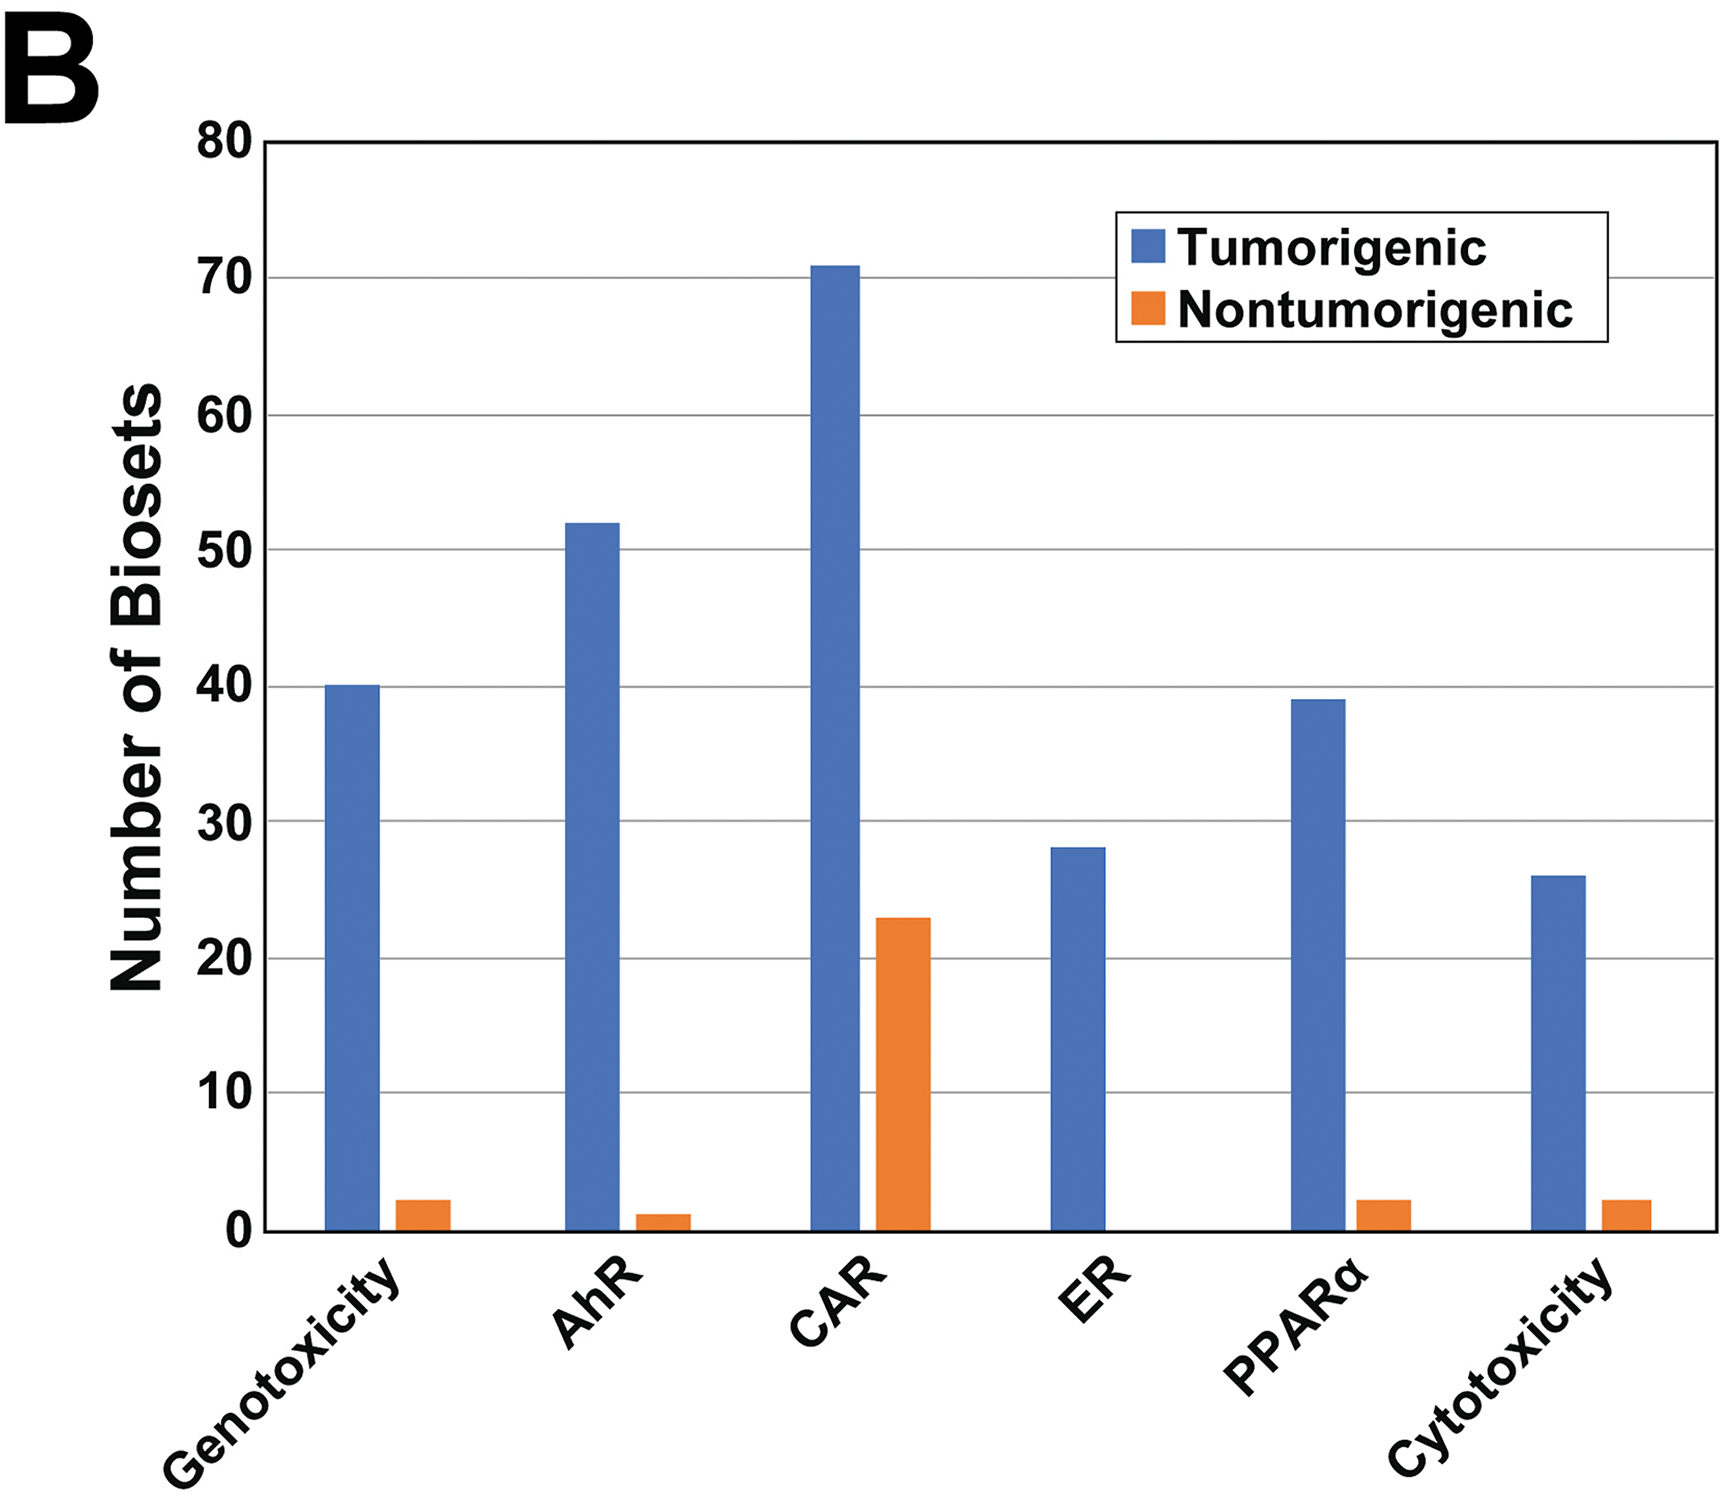
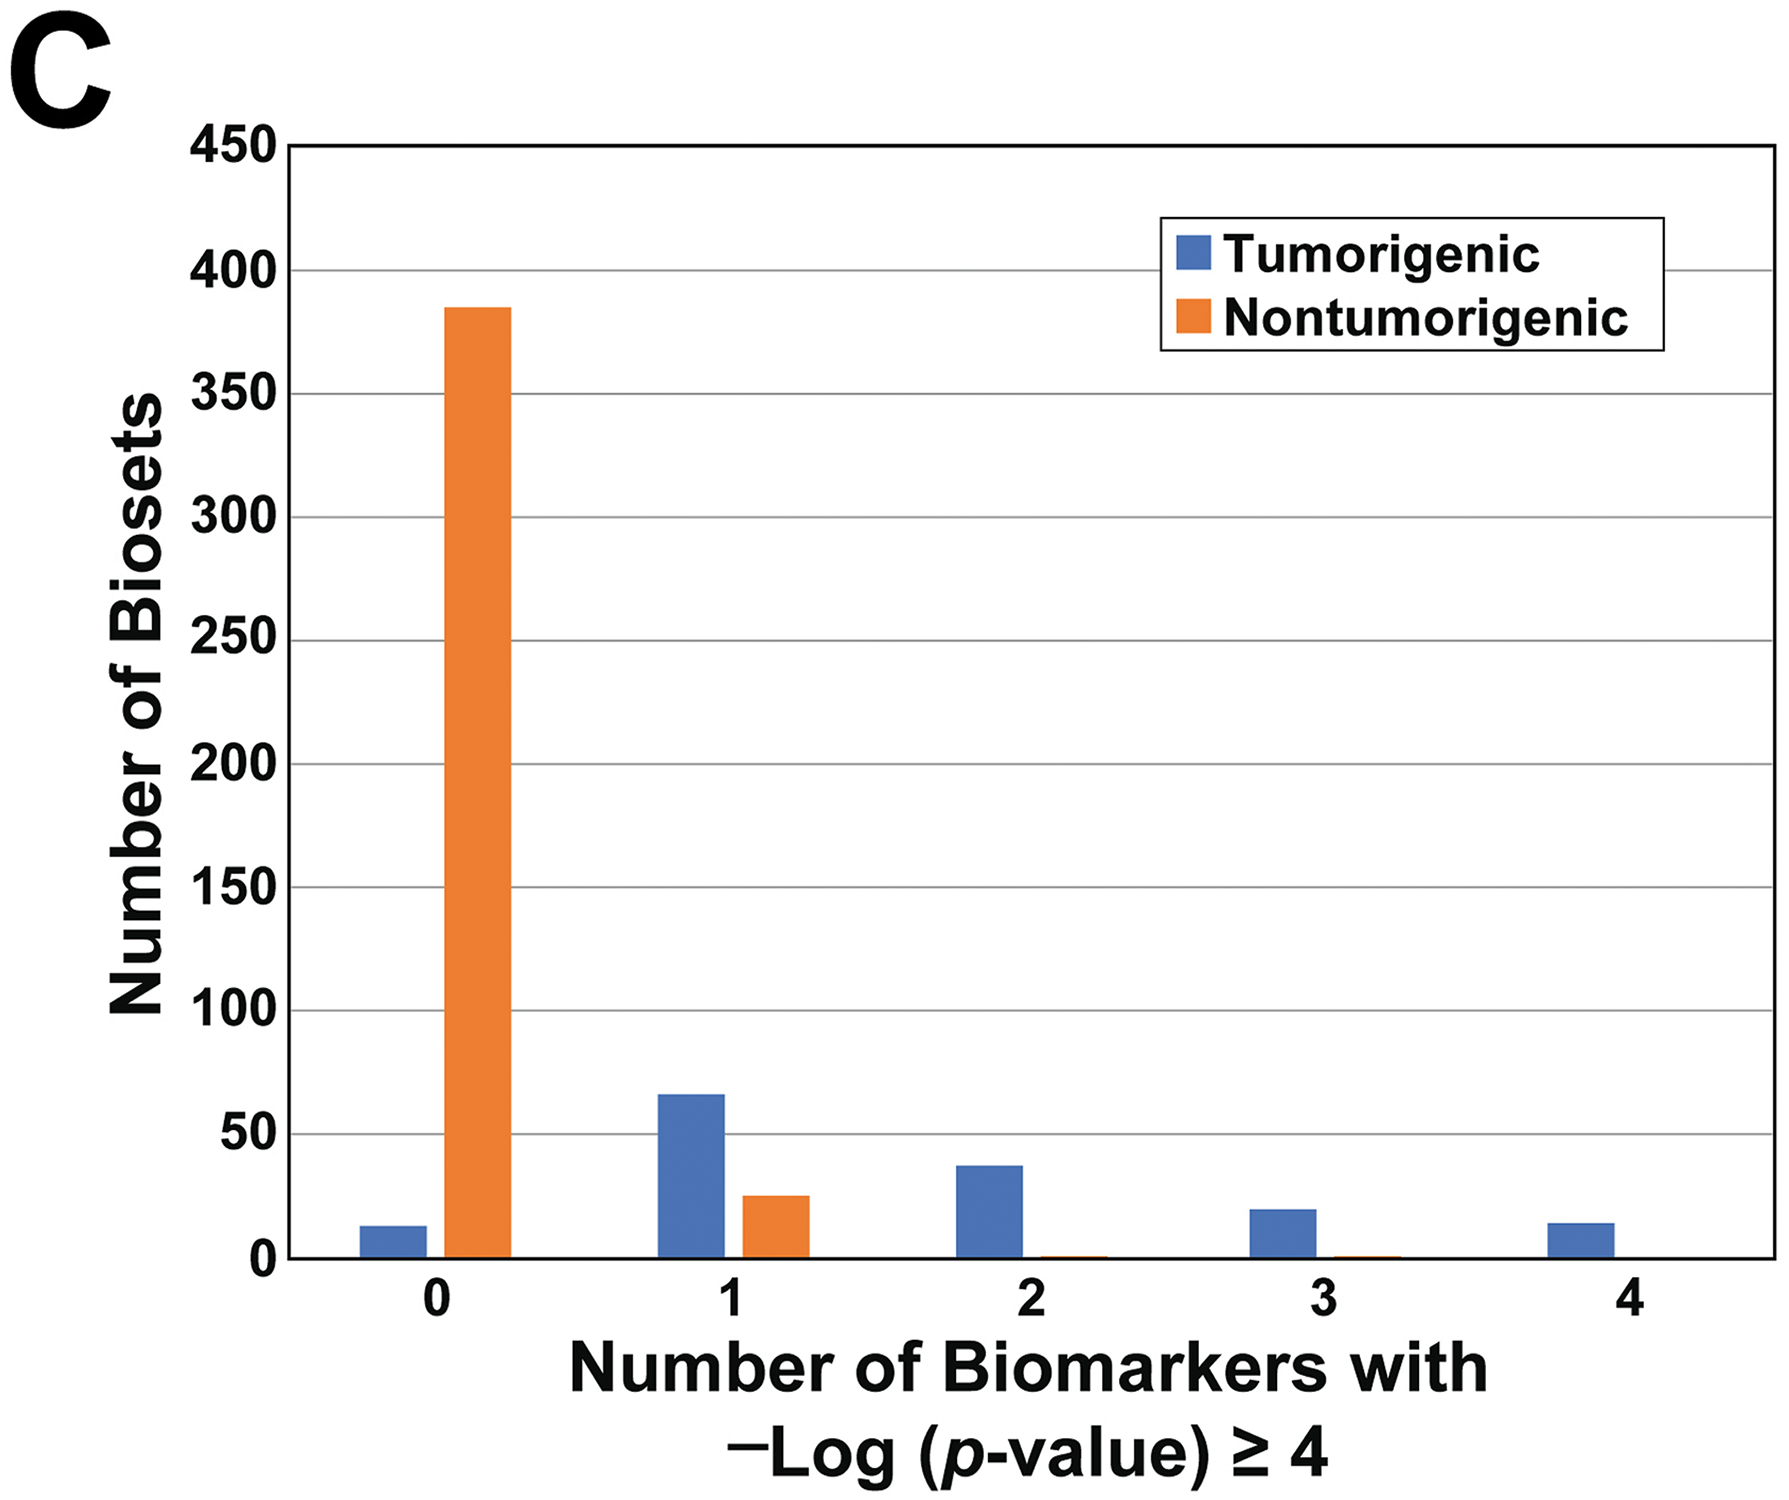
Figure 4. Activation of liver cancer MIEs across the TG-GATES dataset.


A. Heat map showing the modulation of the 6 MIEs across the chemical-dose pairs analyzed in the TG-GATES study. The changes are shown for each MIE for the 4 time points from 4d to 29d. Only biomarker values |−Log(p-value)s| ≥ 4 are shown. All 393 chemical-dose pairs were clustered using one-dimensional hierarchical clustering. The liver tumorigenicity of each chemical-dose pair is shown on the left. Red, tumorigenic; green, nontumorigenic; blue, not known.
B. Activation of the 6 biomarkers after chemical treatment in the TG-GATES dataset. The number of tumorigenic and nontumorigenic biosets that had -Log(p-value) ≥ 4 for each biomarker are shown. The total number of biosets analyzed was 562.
C. Relationship between tumorigenicity and number of MIEs activated. The number of tumorigenic and nontumorigenic biosets that activated 0 to 4 biomarkers are shown.
