
Figure 5. Distribution of ToxPi scores across tumorigenic and nontumorigenic chemicals.
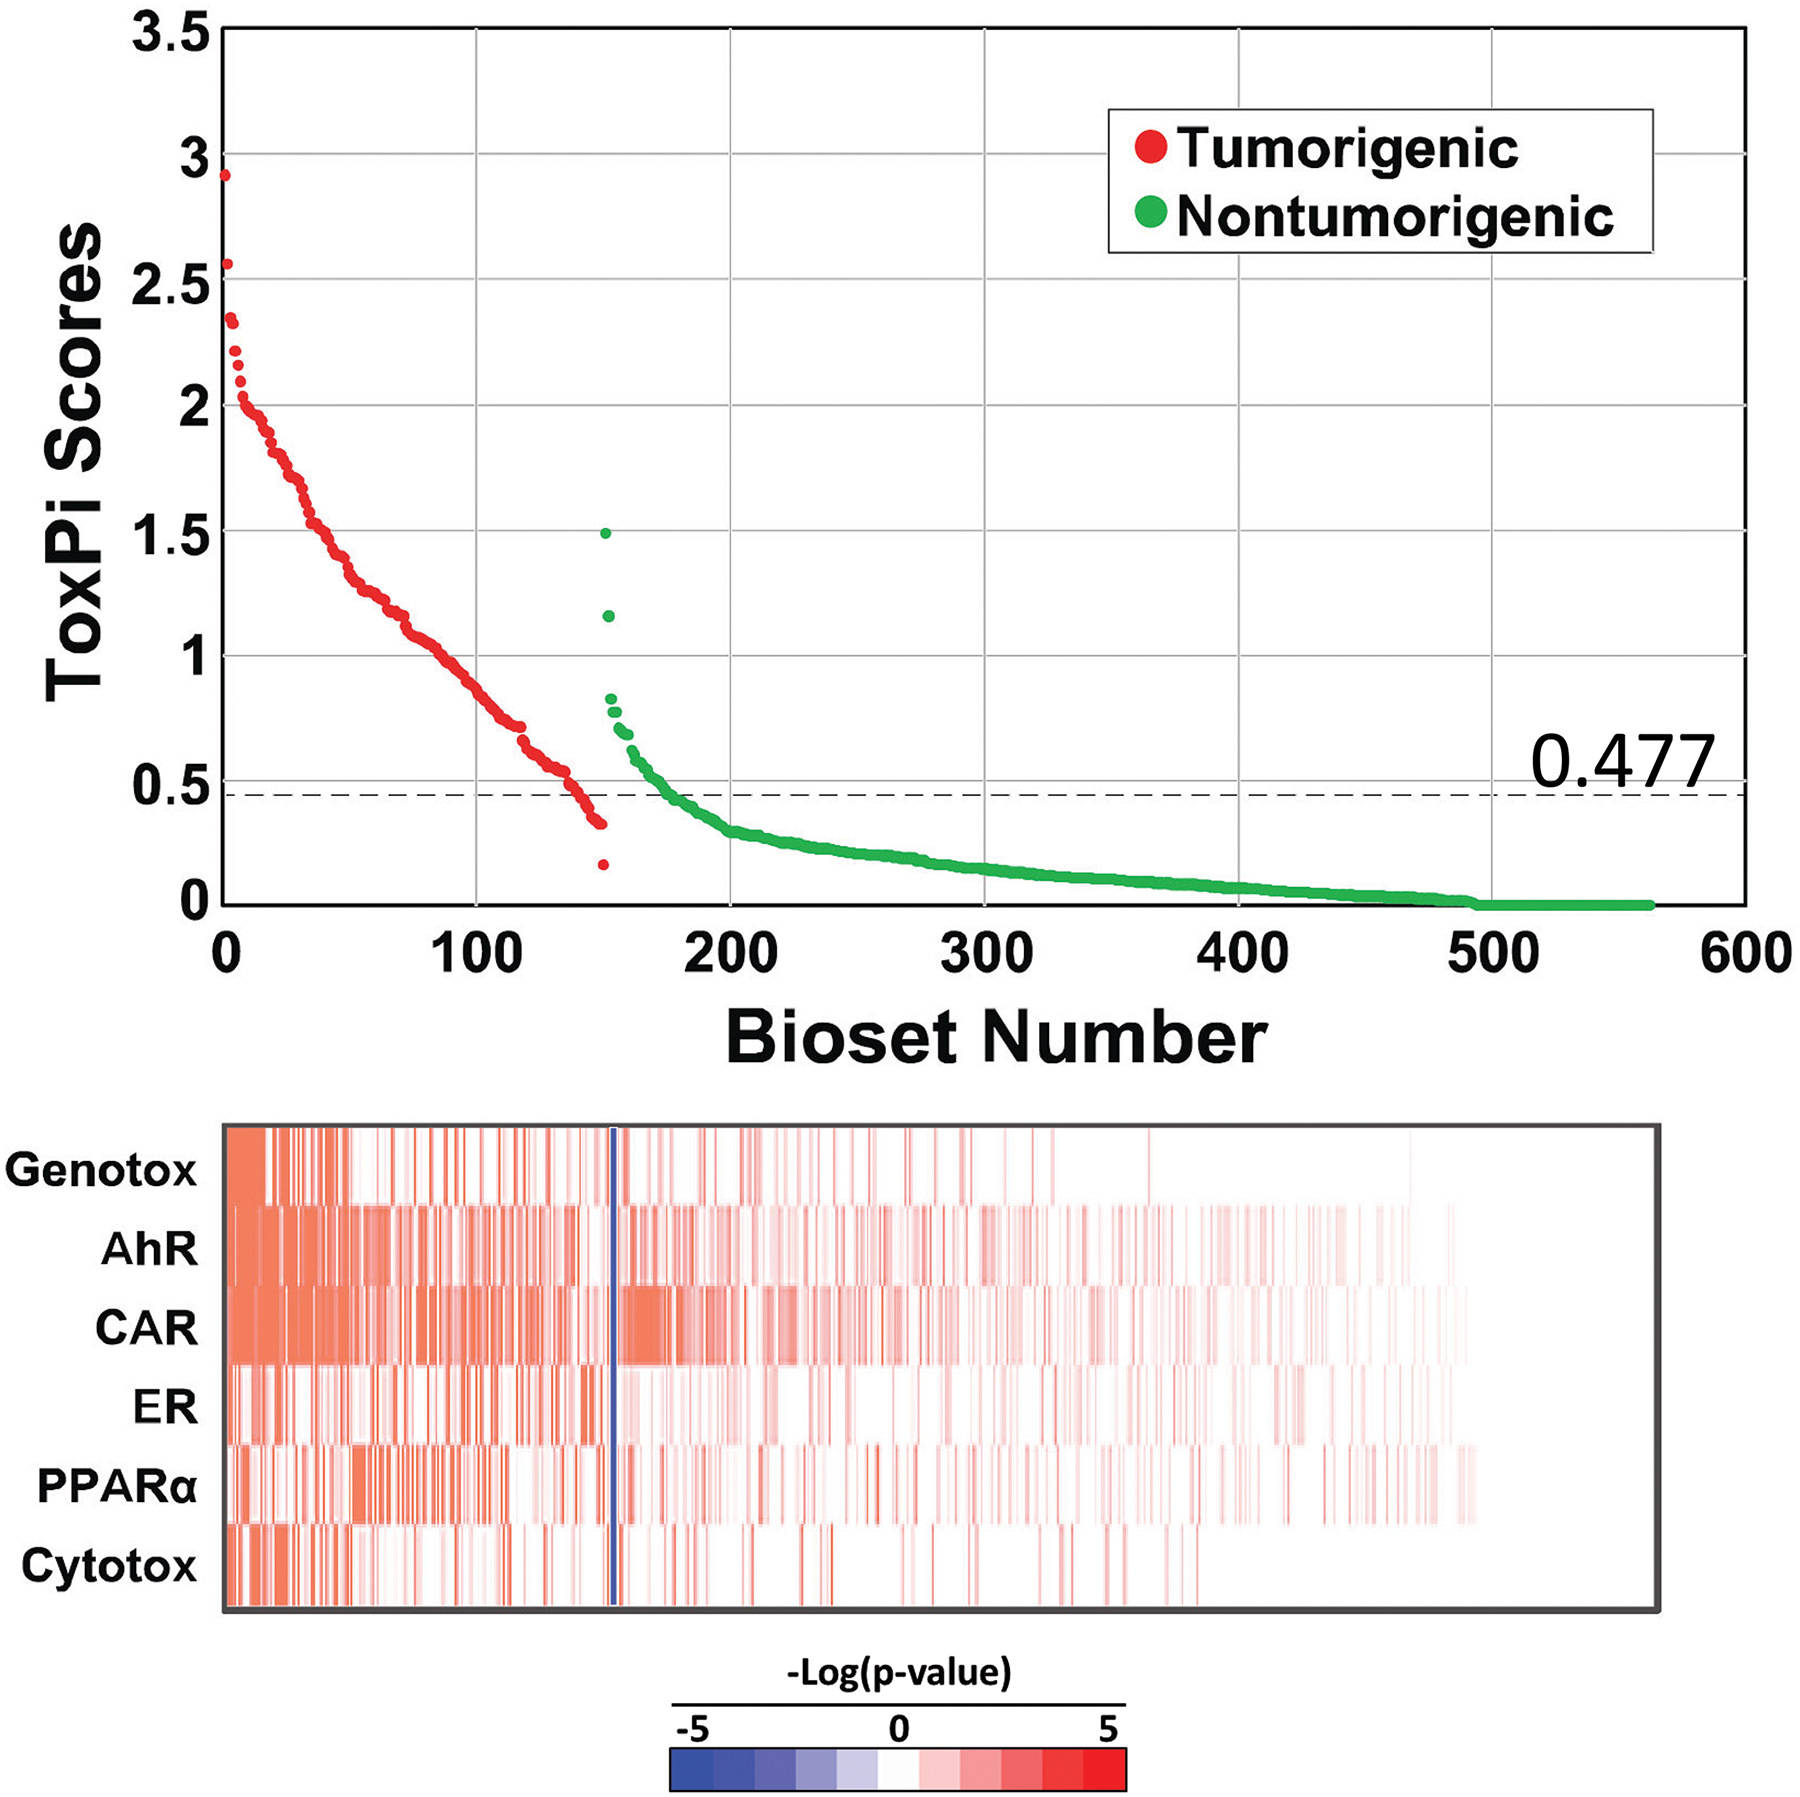
Distribution of ToxPi scores between tumorigenic and nontumorigenic chem-dose-times in the TG-GATES study. ToxPi scores were derived from the -Log(p-value)s of the 6 biomarkers compared to each bioset. (Top) Distribution of scores. The optimal ROC threshold is indicated. (Bottom) Heatmap of -Log(p-value)s of the biomarkers. The blue line separates the tumorigenic and nontumorigenic exposure conditions.