Figure 3.

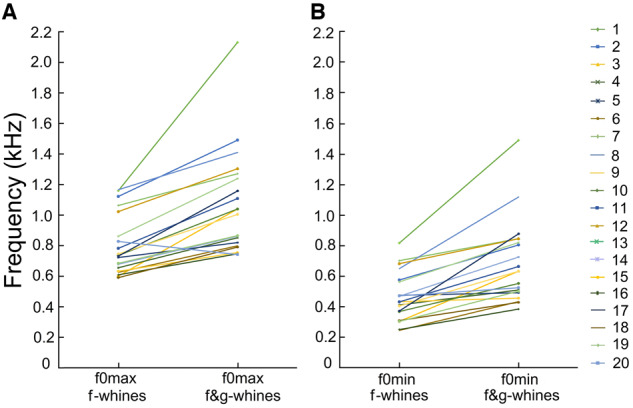
Plots illustrating the differences in (A) f0max between the monophonic f-whines and the biphonic f&g-whines; (B) f0min between the monophonic f-whines and the biphonic f&g-whines.

Plots illustrating the differences in (A) f0max between the monophonic f-whines and the biphonic f&g-whines; (B) f0min between the monophonic f-whines and the biphonic f&g-whines.