
Figure 5.
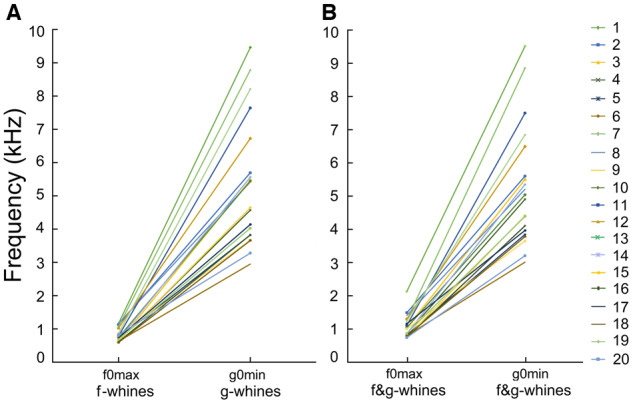
Plots illustrating the differences in (A) f0max and g0min of the monophonic f- and g-whines; (B) f0max and g0min of the biphonic f&g-whines.
Official websites use .gov
A
.gov website belongs to an official
government organization in the United States.
Secure .gov websites use HTTPS
A lock (
) or https:// means you've safely
connected to the .gov website. Share sensitive
information only on official, secure websites.
Plots illustrating the differences in (A) f0max and g0min of the monophonic f- and g-whines; (B) f0max and g0min of the biphonic f&g-whines.