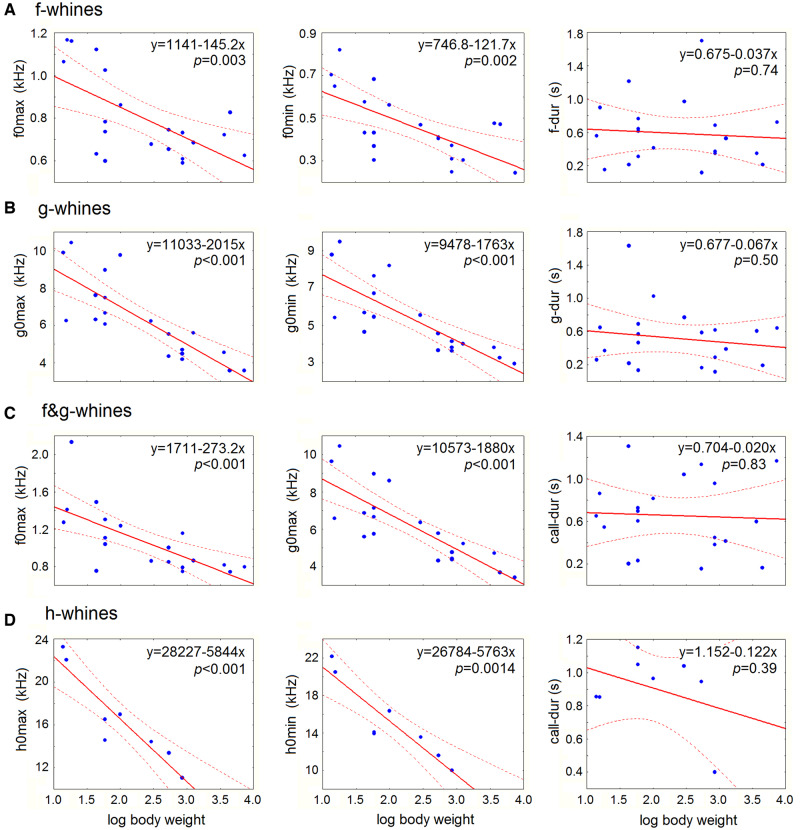
Figure 7.
Scatterplots illustrating the relationships between acoustic variables of different categories of whines and log body mass of the study dogs. (A) f-whines; (B) g-whines; (C) f&g-whines; (D) h-whines. For decoding the abbreviations of measured acoustic variables, see Table 2. Linear regression lines with 95% confidence intervals are shown. P-values indicate the Pearson correlation results.

