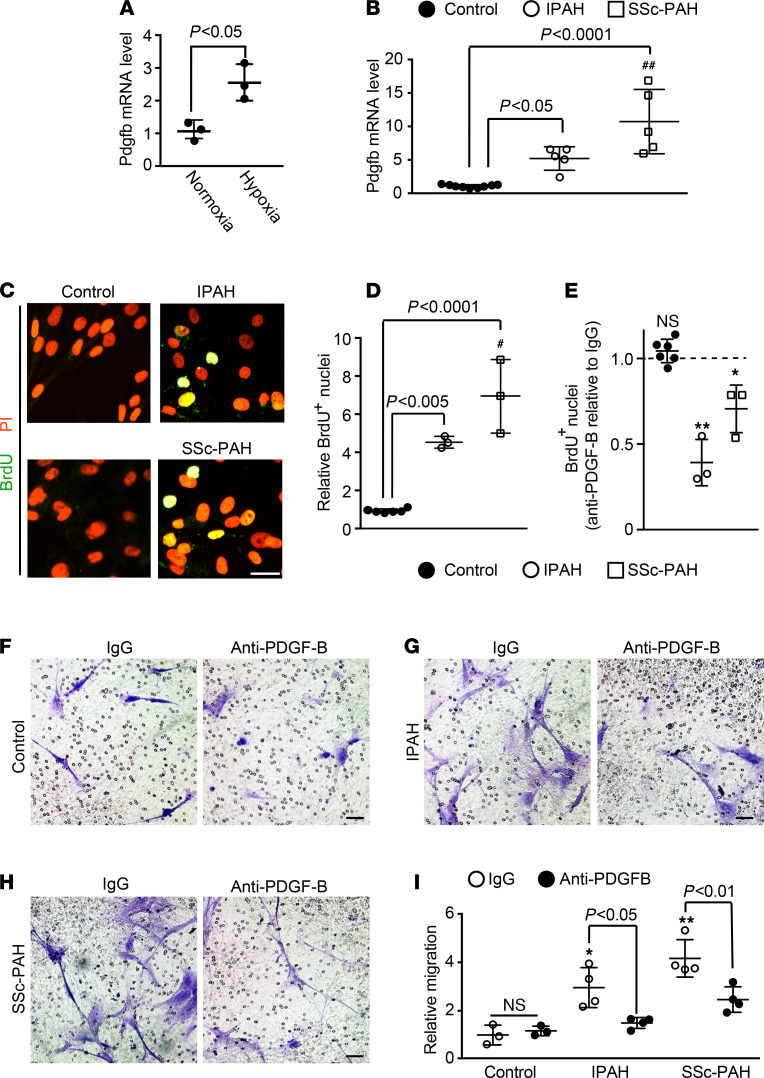
Figure 6. PDGF-B secreted by macrophages from PAH patients promotes hPASMC proliferation and migration.
Monocytes were isolated from PBMCs of human controls and IPAH or SSc-PAH patients and differentiated into macrophages in culture. (A) Macrophages derived from human control monocytes were cultured under normoxic or hypoxic (3% O2) conditions for 12 hours, and then Pdgfb mRNA levels were measured by qRT-PCR. n = 3 humans (2 females and 1 male, aged 30–60 years old) with qRT-PCR done in triplicate. (B) qRT-PCR was used to assay Pdgfb mRNA levels of macrophages from controls and PAH patients. n = 5 humans per PAH diagnostic class, and n = 9 controls (see Supplemental Table 4), with qRT-PCR done in triplicate. (C–E) hPASMCs were cultured for 24 hours with medium preconditioned by control and patient macrophages. BrdU was included in the last 10 hours of this incubation. Cells were then stained for BrdU and nuclei (PI). (D) The percentage of total cells (PI+ nuclei) expressing BrdU for control humans and patients was normalized to this percentage for controls. (E) Anti–PDGF-B blocking antibody or control IgG was added to the conditioned medium 1 hour prior to incubation with hPASMCs. Results are the ratio of the percentage of total (PI+) cells that are BrdU+ for anti–PDGF-B treatment relative to IgG treatment, stratified by patient diagnostic class. n = 3 humans per PAH diagnostic class and n = 6 controls (see Supplemental Table 5), with 10 microscopic fields per human, 30–60 cells per field. (F–I) Medium preconditioned by control or patient macrophages was treated with anti–PDGF-B blocking or control IgG antibody for 1 hour and then placed in the bottom chamber of a Boyden apparatus. hPASMCs were added to the top chamber to assess migration toward the conditioned medium for 8 hours. Migrated cells (i.e., on the membrane’s bottom surface) were stained with Crystal Violet. (I) Quantification of the migrated cells relative to control patients, IgG treatment is shown. n = 4 humans per PAH class and n = 3 controls (see Supplemental Table 7), with 5 microscopic fields per human, 8–90 cells per field. One-way ANOVA with Tukey’s multiple-comparison test (B, D, and I) and Student’s t test were used (A and E). #, ## vs. IPAH, P < 0.05, <0.01, and *, **, ns vs. corresponding IgG controls, P < 0.05, < 0.01, not significant, respectively. Scale bars: 25 μm (C) and 50 μm (F–H).

