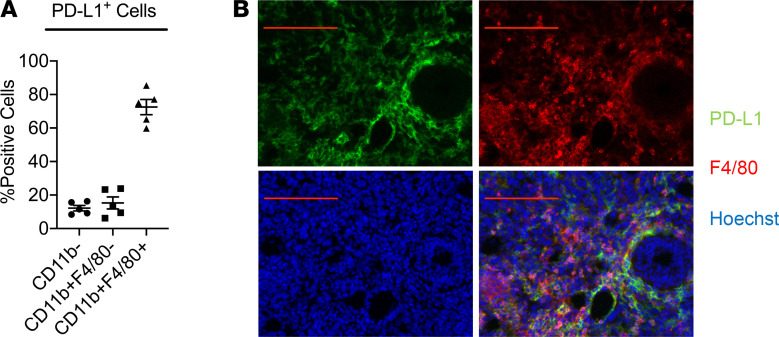
Figure 2. The majority of the PD-L1+ cells within the TME are TAMs.
(A) Percentages of CD11b–, CD11b+F4/80–, and CD11b+F4/80+ cells within PD-L1+ population were assessed with FACS. (B) Immunofluorescence staining of PD-L1 (shown in green) and F4/80 (shown in red) in subcutaneously inoculated Hepa1-6 tumors. Scale bar: 100 μm. Values are mean ± SEM of a minimum of 3 independent experiments. n = 5 biological replicates per group (A and B).

