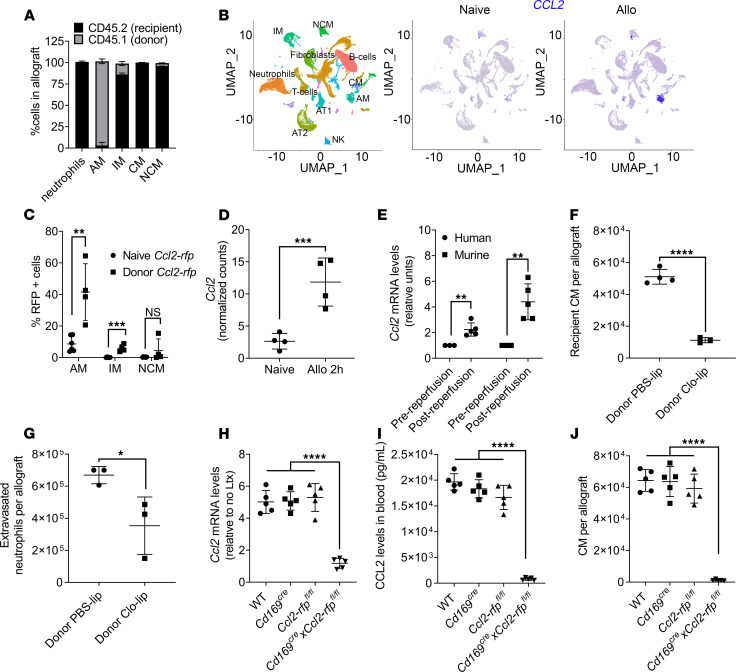
Figure 3. Depletion of donor alveolar macrophages (AM) suppresses recruitment of recipient classical monocytes (CM) to the transplanted lung.
(A) Flow cytometry showing percentage of cells of donor (CD45.1) and recipient (CD45.2) origin in the allograft 24 hours after transplantation. Neutrophils were gated as live CD45+Ly6G+CD11b+CD24+SSChi; AM were gated as live CD45+Ly6G–NK1.1–SiglecF+CD64+CD11c+; CM were gated as live CD45+Ly6G–NK1.1–CD11b+SiglecF–CD24–Ly6Chi; NCM were gated as live CD45+Ly6G–NK1.1–CD11b+SiglecF–CD24–Ly6Clo (n = 3); and interstitial macrophages (IM) were gated as live CD45+Ly6G–NK1.1–CD11b+MHC II+CD11c+CD64+CD24− (n = 3–6). (B) UMAP plot (left) and feature plots (middle and right) showing specific cell populations and expression of Ccl2 in naive lungs and in allografts (Allo) 24 hours after transplant. (C) Flow cytometry showing percentage of RFP+ cells in lung allografts after transplantation of donor Ccl2-rfp grafts into WT recipient. AM and NCM were gated as in A. (D) Normalized counts per minute (CPM) of Ccl2 in sorted mouse AM isolated from allografts 2 hours after transplant (n = 4). (E) Relative Ccl2 mRNA levels of human and mouse AM isolated before and after reperfusion (n = 3–5). (F) Flow cytometry quantification of CM gated as in A, recruited into the allograft after intratracheal administration of PBS liposomes (PBS-lip) or clodronate liposomes (Clo-lip) in the donor mice (n = 4). (G) Flow cytometry quantification of extravasated neutrophils in the allograft gated as in A, after intratracheal administration of PBS-lip or Clo-lip in donor mice (n = 3). (H) Relative Ccl2 mRNA levels in AM isolated from WT, Cd169Cre, Ccl-rfpfl/fl, and Cd169CreCcl2-rfpfl/fl allografts and compared with naive AM (n = 5). (I) Blood CCL2 levels after transplant combinations described in H (n = 5). (J) Flow cytometry quantification of CM gated as in A, after transplant combinations described in H (n = 5). Graphs show means ± SD. Graphs in C–G were analyzed by unpaired Student’s t test. Graphs in H–J were analyzed by 1-way ANOVA followed by Tukey’s post hoc test. *P < 0.05; **P < 0.01; ***P < 0.001; ****P < 0.0001.

