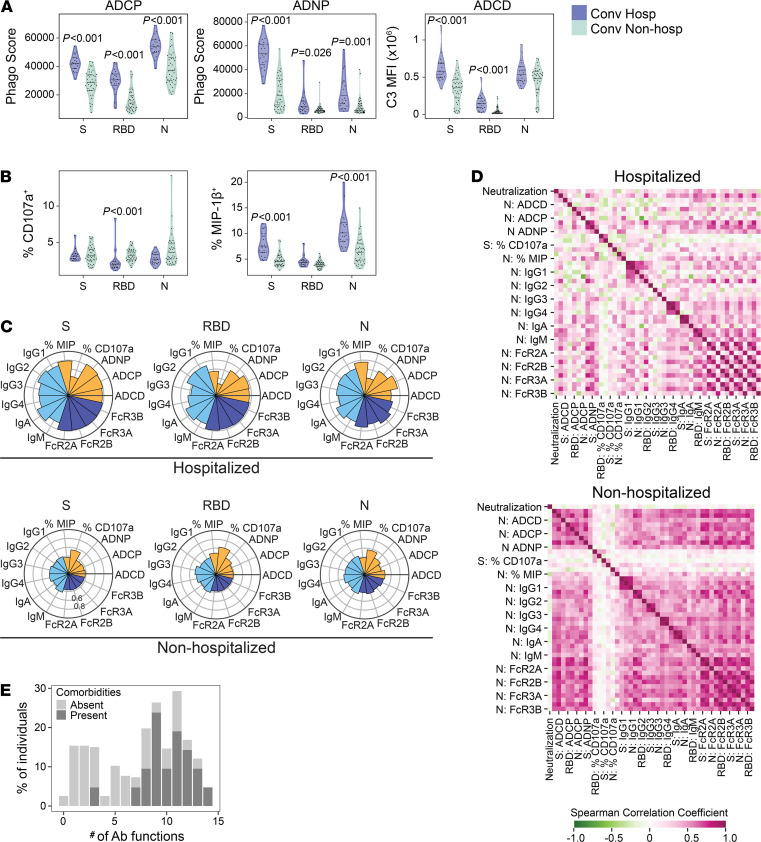
Figure 2. Antibody functional profiles are associated with hospitalization after COVID-19.
SARS-CoV-2–specific antibody phenotypes and functional profiles were compared between hospitalized (purple, n = 20) and nonhospitalized (green, n = 40) COVID-19 study subjects. (A and B) Antibody-dependent cellular phagocytosis (ADCP), antibody-dependent neutrophil phagocytosis (ADNP), antibody-dependent complement deposition (ADNP) (A), and NK cell activation as measured by MIP-1β secretion or CD107a expression (B) against spike (S), receptor binding domain (RBD), and nucleocapsid (N) was quantified and compared between groups. (C) Nightingale rose graphs show the distribution around the mean profiles of antibody features for S, RBD, and N among hospitalized and nonhospitalized subjects. Each flower petal represents a SARS-CoV-2–specific antibody measurement. The size of the petal depicts the percentile above/below the mean across both groups. The colors indicate type of feature: antibody function (orange), titer (light blue), and Fc-receptor binding (dark blue). (D) The correlation matrix shows the Spearman correlation coefficient for antibody features separately in hospitalized and nonhospitalized subjects. Pink indicates a positive correlation, whereas green indicates a negative correlation. (E) Polyfunctional antibody profiles were compared between subjects with and without comorbidities. To determine polyfunctionality, an individual’s response was noted to be functional if it was above the median response for the cohort. Per person, the number of positive functions was summed, resulting in a polyfunctionality score per individual. Polyfunctional scores are displayed as percent positivity of the whole cohort. Antibody phenotypes and effector functions excluding neutralization were compared across groups using Mann-Whitney U tests, followed by correction for multiple hypothesis testing using the Bonferroni method. Median, 25th, and 75th quartiles are indicated for violin plots. If not shown, P values for Mann-Whitney U tests were not significant.

